29
/
en
AIzaSyAYiBZKx7MnpbEhh9jyipgxe19OcubqV5w
April 1, 2024
112103
Costa Rica
CRI
true
2
1
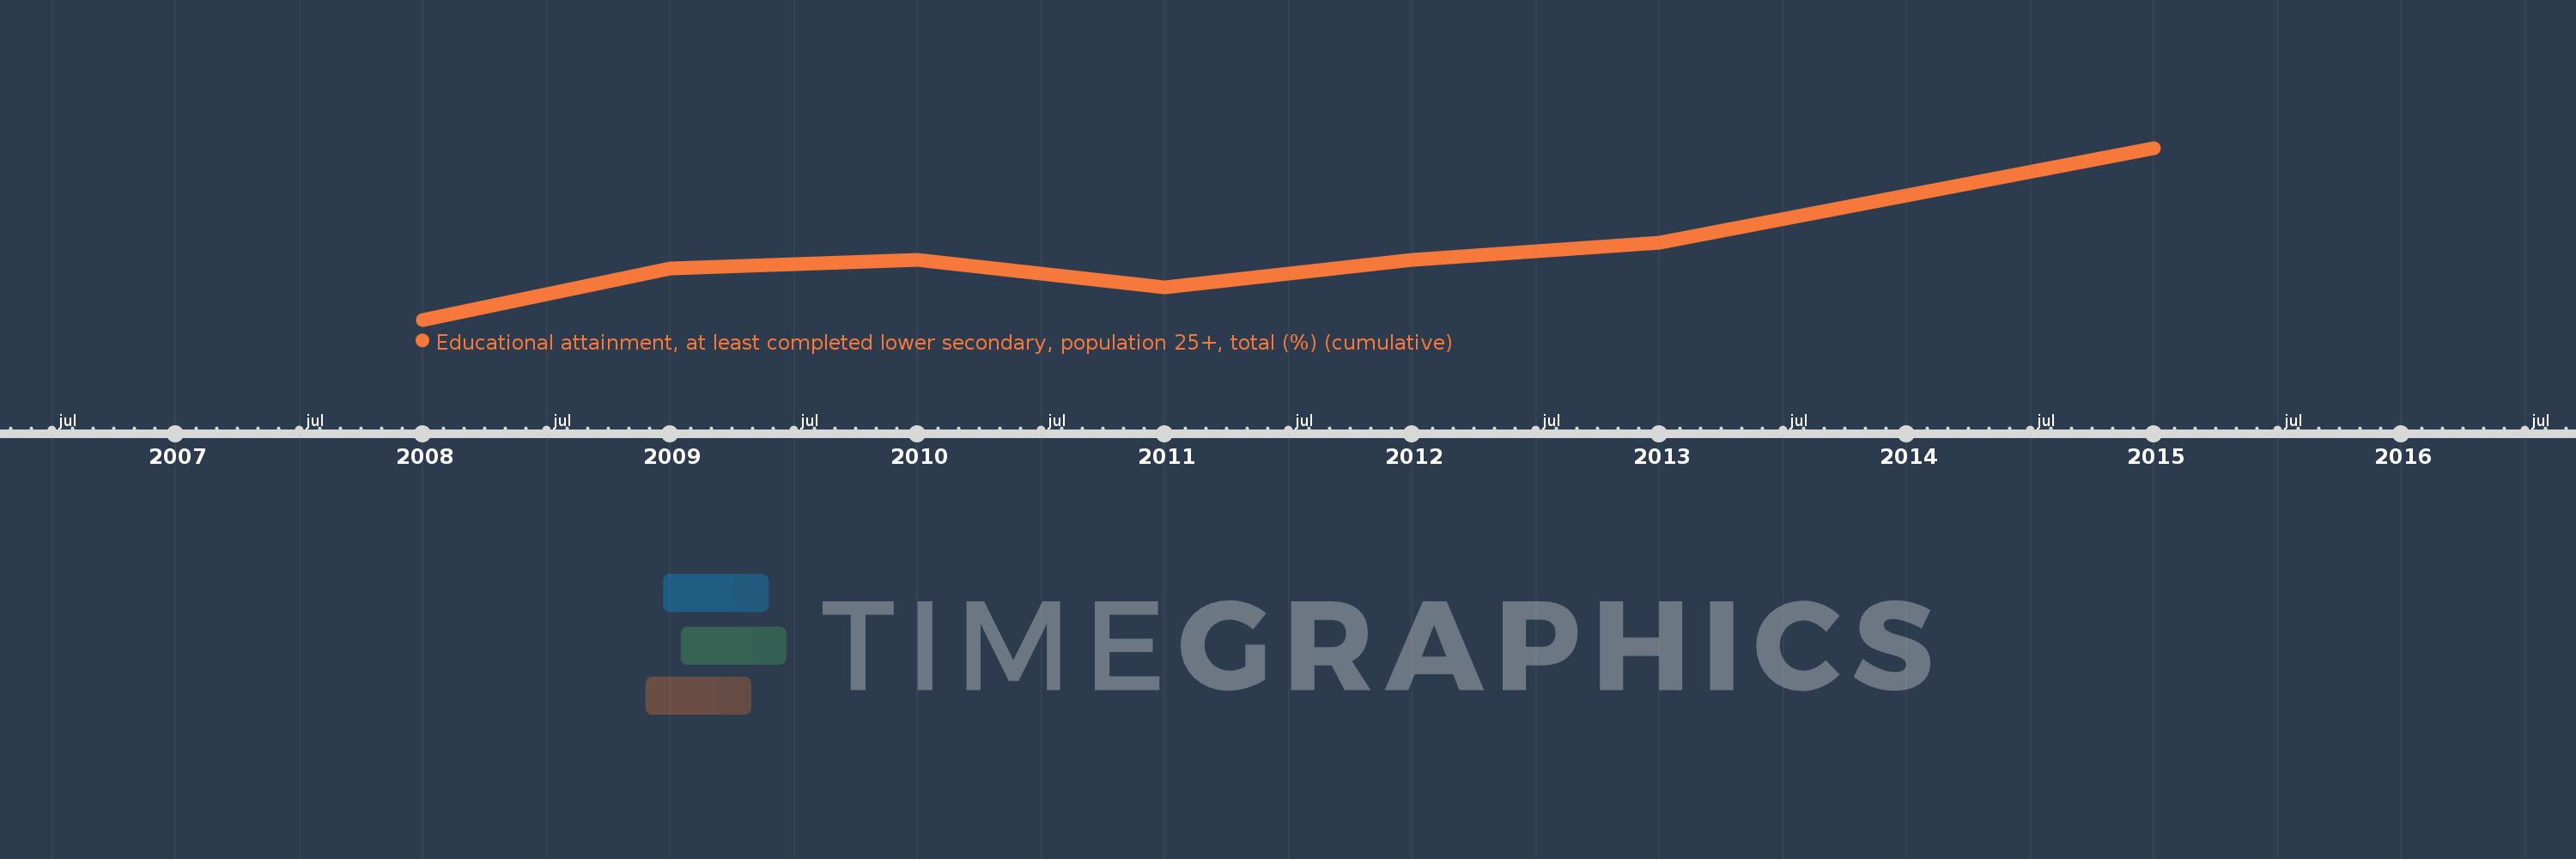
Educational attainment, at least completed lower secondary, population 25+, total (%) (cumulative)
2015,2013,2012,2011,2010,2009,2008
This statistics in other country:
Timeline:
This timeline shows a graph from 2008 to 2015 of Costa Rica. No data until 2007. Number of actual observations by date: 7.
Source name:
World Development Indicators
Source organization:
United Nations Educational, Scientific, and Cultural Organization (UNESCO) Institute for Statistics.
Categories, topics:
Education, Gender
Last updated:
apr 23, 2017
Indicators value changes by year
Minimum:
47.677
jan 1, 2008
Maximum:
54.667
jan 1, 2015
At the date of observation
Value
Absolute change
Change from previous value
jan 1, 2008
47.677
+47.677
0.0%
jan 1, 2009
49.773
+2.096
4.4%
jan 1, 2010
50.111
+0.338
0.68%
jan 1, 2011
48.989
-1.122
-2.24%
jan 1, 2012
50.125
+1.136
2.32%
jan 1, 2013
50.816
+0.69
1.38%
jan 1, 2015
54.667
+3.852
7.58%
Ranking of countries by current statistics by years


Comments: