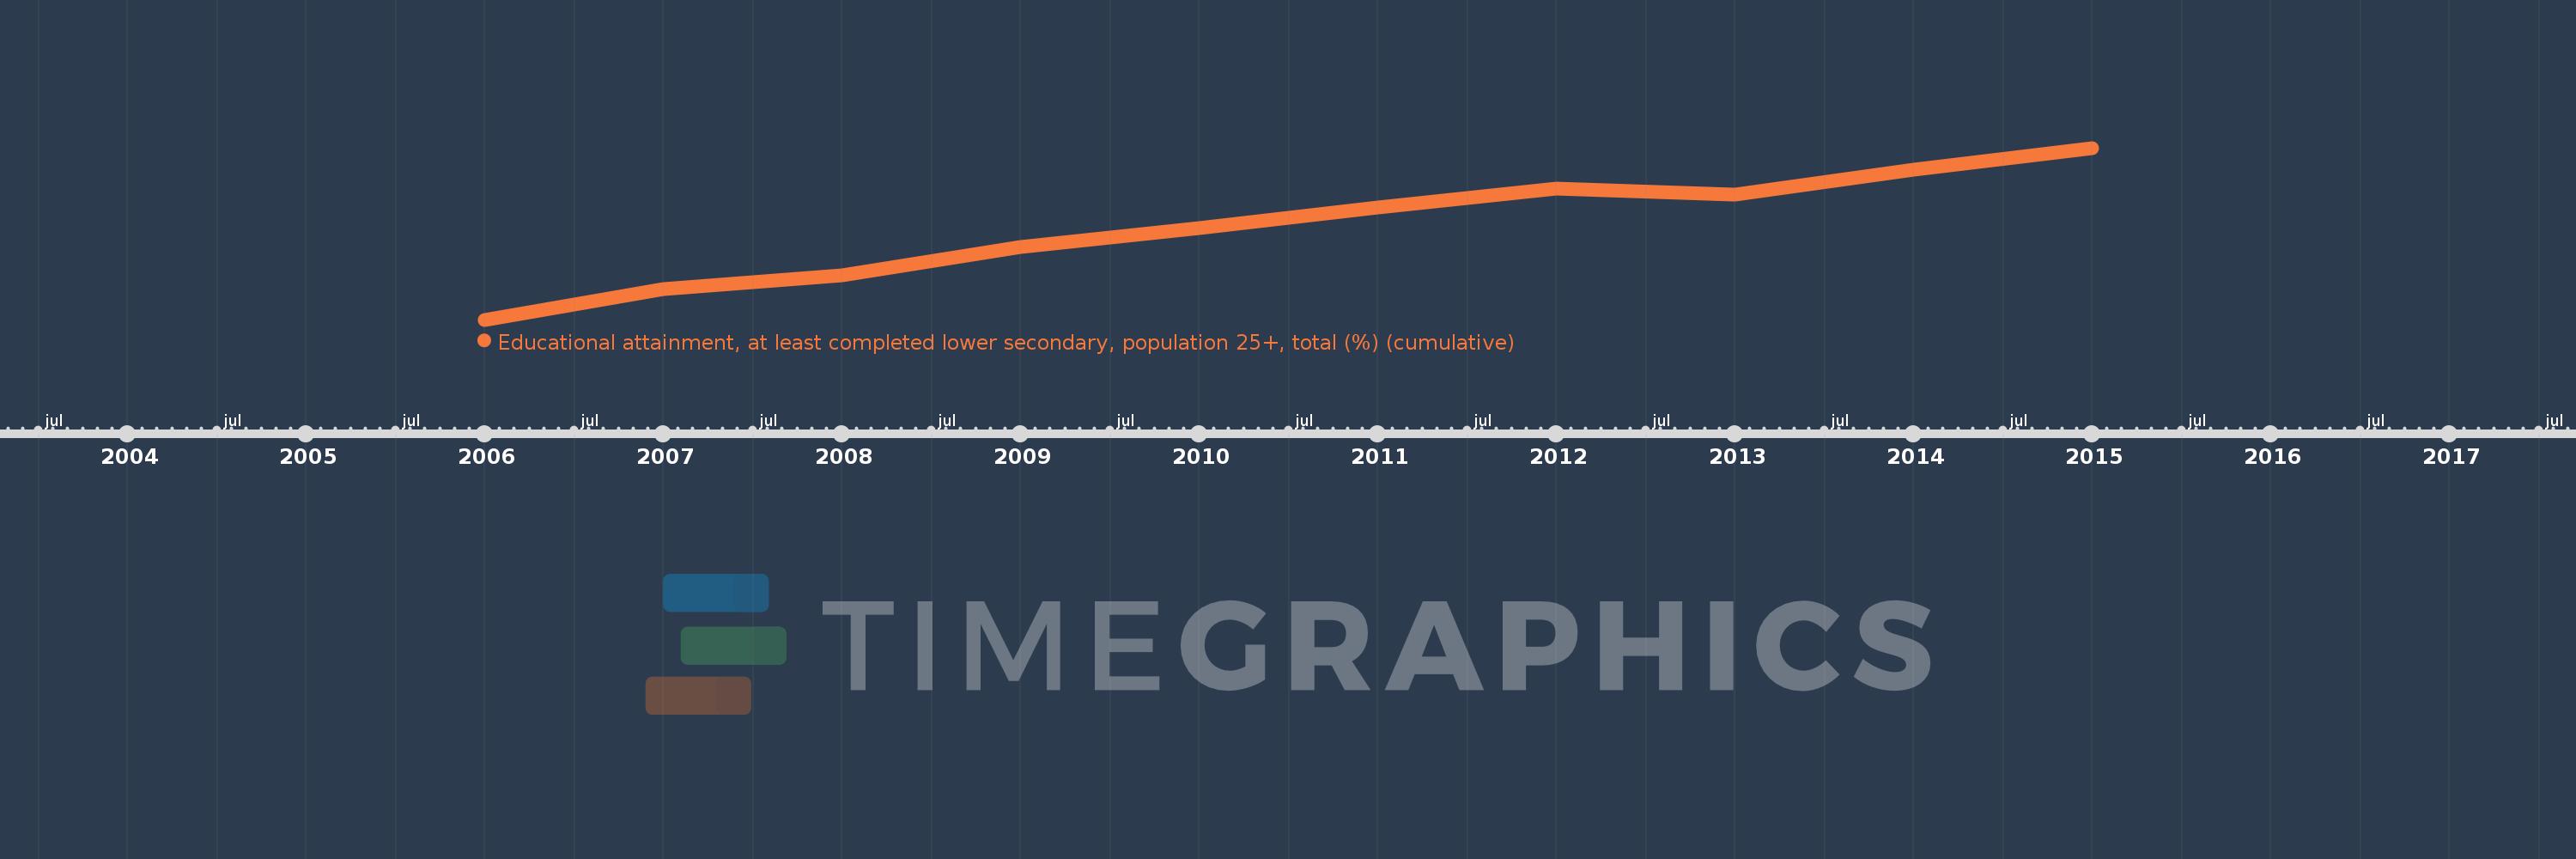
Questa scala temporale mostra un grafico dal 2006 anno al 2015 anno. Lithuania. I dati fino ad 2005 anno non disponibili. Il numero di osservazioni attuali secondo i date: 10.
La fonte (nome):
Indicatori dello sviluppo mondiale
La fonte (organizzazione):
United Nations Educational, Scientific, and Cultural Organization (UNESCO) Institute for Statistics.
Categorie:
Education, Gender
sono stati aggiornati
23 apr 2017 anni
Indicatori delle variazioni dei valori per anni
In media:
90.277
Minima:
86.98
1 gen 2006 anni
Massimo:
93.064
1 gen 2015 anni
Alla data di osservazione
Valore
Variazione assoluta
La variazione rispetto al valore precedente
1 gen 2006 anni
86.98
+86.98
0.0%
1 gen 2007 anni
88.07
+1.09
1.25%
1 gen 2008 anni
88.557
+0.486
0.55%
1 gen 2009 anni
89.562
+1.005
1.14%
1 gen 2010 anni
90.241
+0.679
0.76%
1 gen 2011 anni
90.96
+0.719
0.8%
1 gen 2012 anni
91.634
+0.675
0.74%
1 gen 2013 anni
91.415
-0.219
-0.24%
1 gen 2014 anni
92.289
+0.874
0.96%
1 gen 2015 anni
93.064
+0.775
0.84%
Classificazione dei paesi secondo i statistiche attuali per anni
