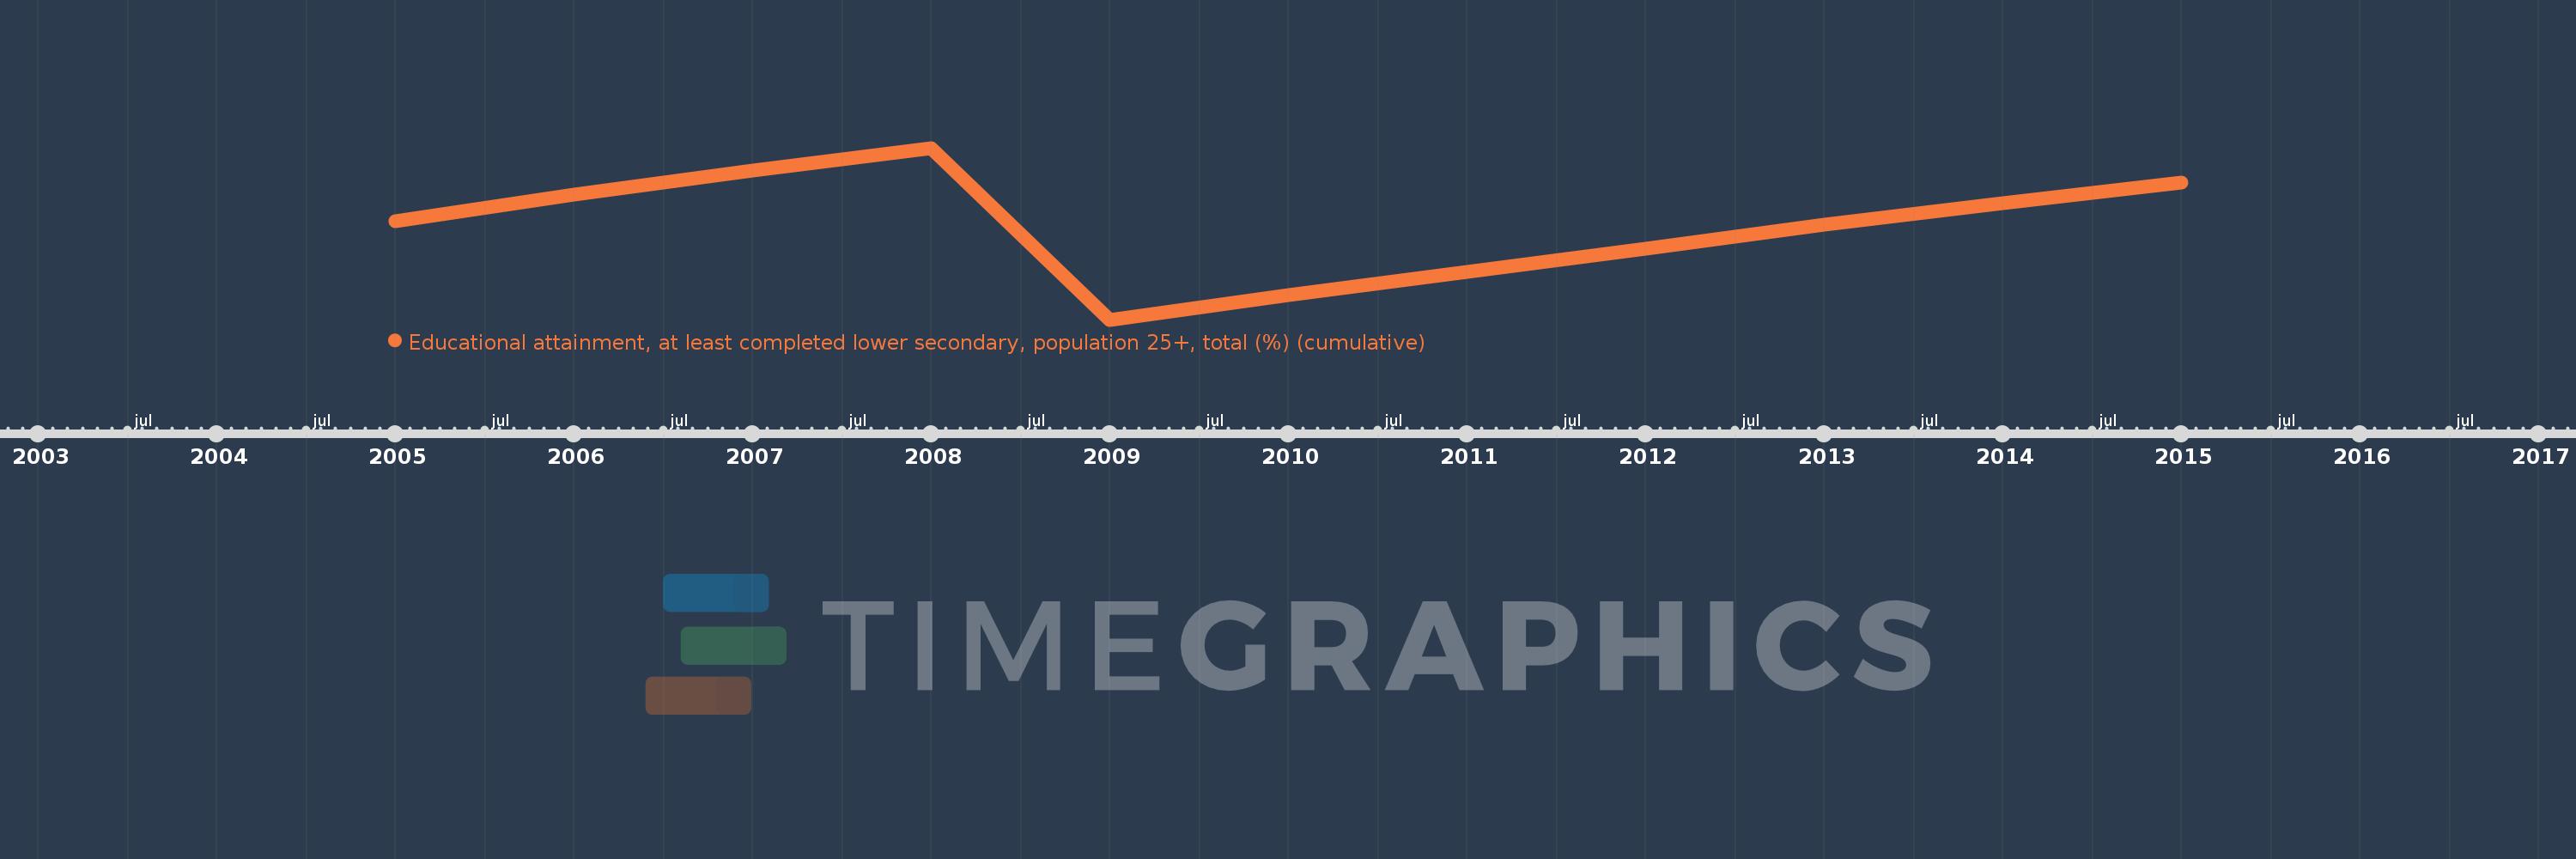
Questa scala temporale mostra un grafico dal 2005 anno al 2015 anno. Sweden. I dati fino ad 2004 anno non disponibili. Il numero di osservazioni attuali secondo i date: 11.
La fonte (nome):
Indicatori dello sviluppo mondiale
La fonte (organizzazione):
United Nations Educational, Scientific, and Cultural Organization (UNESCO) Institute for Statistics.
Categorie:
Education, Gender
sono stati aggiornati
23 apr 2017 anni
Indicatori delle variazioni dei valori per anni
In media:
88.319
Minima:
85.782
1 gen 2009 anni
Massimo:
90.407
1 gen 2008 anni
Alla data di osservazione
Valore
Variazione assoluta
La variazione rispetto al valore precedente
1 gen 2005 anni
88.423
+88.423
0.0%
1 gen 2006 anni
89.142
+0.719
0.81%
1 gen 2007 anni
89.801
+0.66
0.74%
1 gen 2008 anni
90.407
+0.606
0.67%
1 gen 2009 anni
85.782
-4.625
-5.12%
1 gen 2010 anni
86.443
+0.661
0.77%
1 gen 2011 anni
87.07
+0.627
0.73%
1 gen 2012 anni
87.704
+0.634
0.73%
1 gen 2013 anni
88.334
+0.63
0.72%
1 gen 2014 anni
88.927
+0.593
0.67%
1 gen 2015 anni
89.475
+0.548
0.62%
Classificazione dei paesi secondo i statistiche attuali per anni
