29
/
en
AIzaSyAYiBZKx7MnpbEhh9jyipgxe19OcubqV5w
April 1, 2024
138719
Georgia
GEO
true
2
1
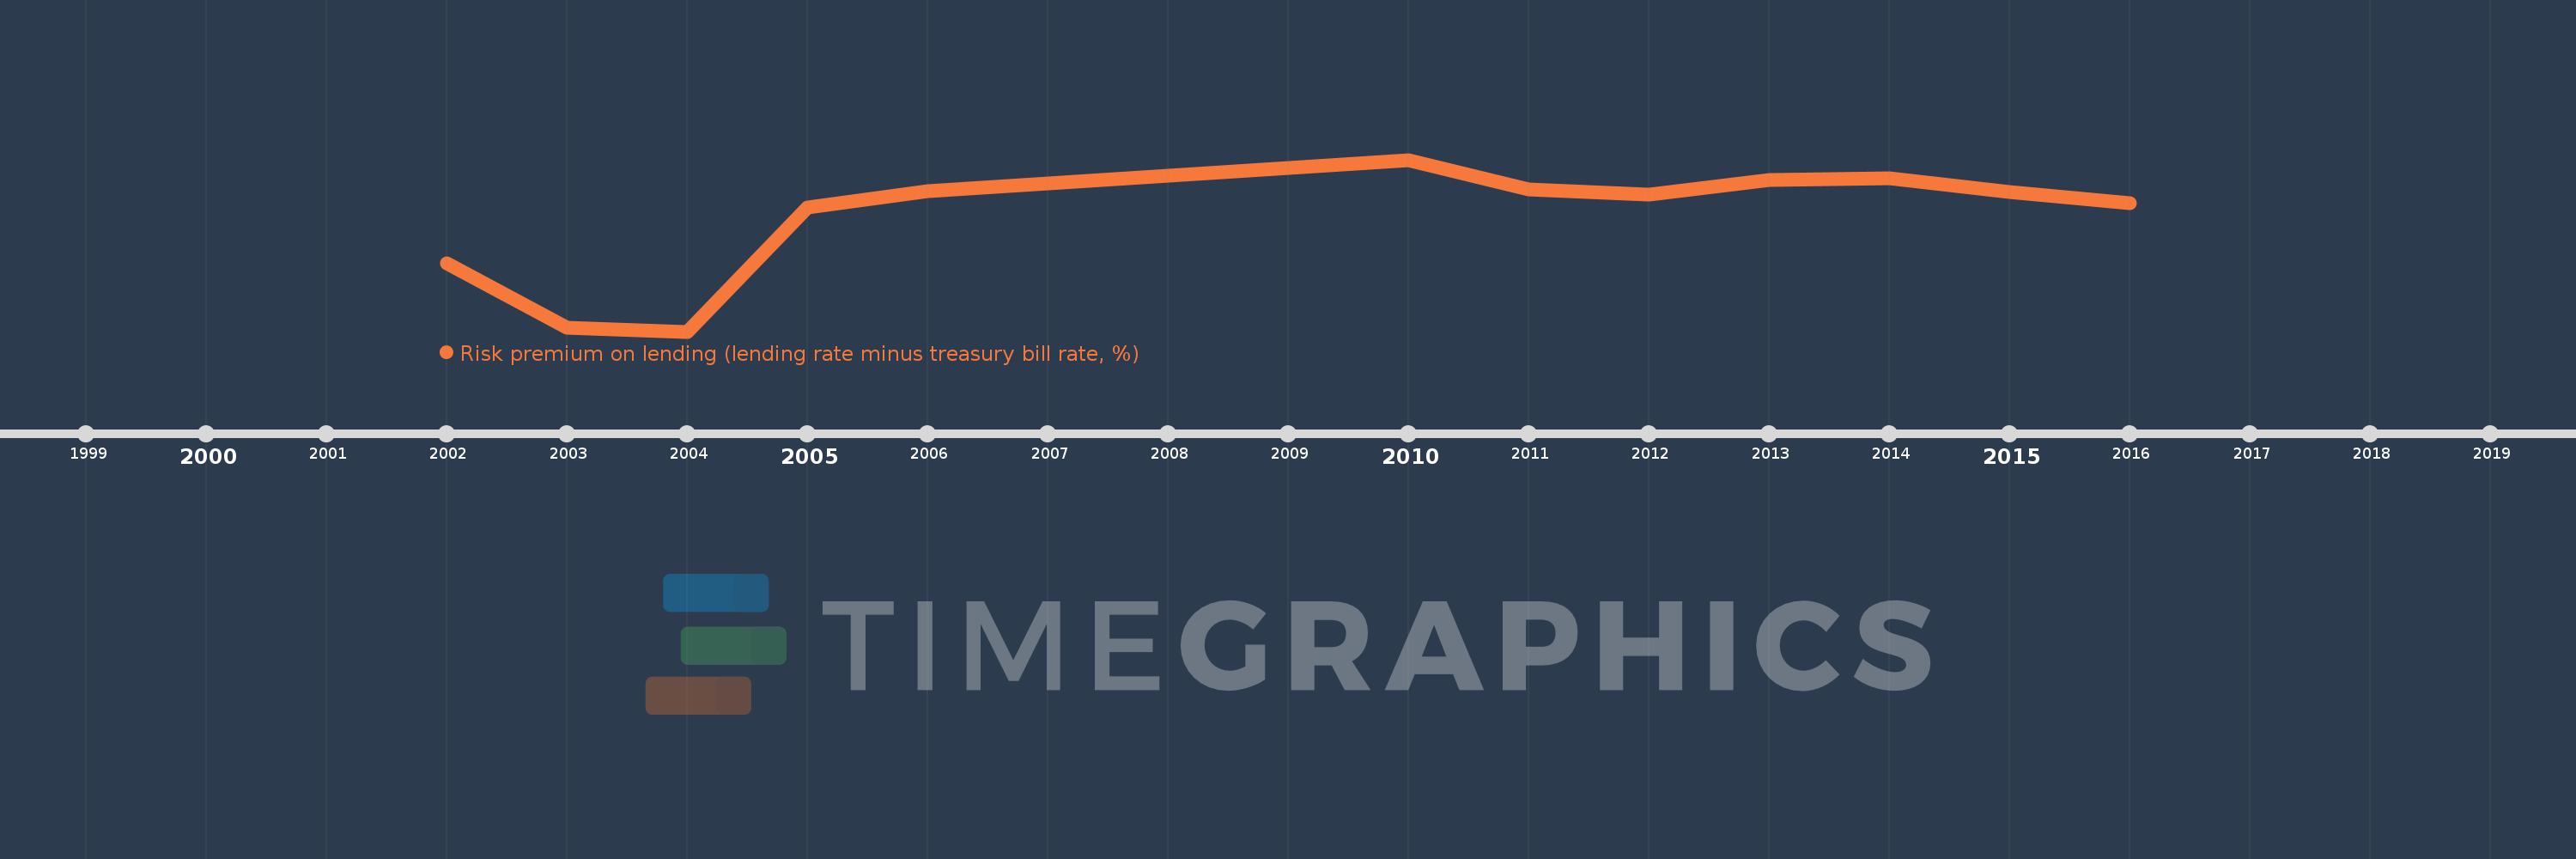
Risk premium on lending (lending rate minus treasury bill rate, %)
2016,2015,2014,2013,2012,2011,2010,2006,2005,2004,2003,2002
This statistics in other country:
Timeline:
This timeline shows a graph from 2002 to 2016 of Georgia. No data until 2001. Number of actual observations by date: 12.
Source name:
World Development Indicators
Source organization:
International Monetary Fund, International Financial Statistics database.
Categories, topics:
Financial Sector
Last updated:
apr 23, 2017
Indicators value changes by year
Minimum:
-20.507
jan 1, 2004
Maximum:
11.886
jan 1, 2010
At the date of observation
Value
Absolute change
Change from previous value
jan 1, 2002
-7.659
-7.659
0.0%
jan 1, 2003
-19.84
-12.181
159.04%
jan 1, 2004
-20.507
-0.668
3.36%
jan 1, 2005
2.928
+23.435
-114.28%
jan 1, 2006
5.934
+3.006
102.67%
jan 1, 2010
11.886
+5.952
100.3%
jan 1, 2011
6.291
-5.595
-47.07%
jan 1, 2012
5.311
-0.98
-15.58%
jan 1, 2013
8.048
+2.737
51.54%
jan 1, 2014
8.435
+0.386
4.8%
jan 1, 2015
5.741
-2.694
-31.94%
jan 1, 2016
3.711
-2.029
-35.35%
Ranking of countries by current statistics by years


Comments: