29
/
en
AIzaSyAYiBZKx7MnpbEhh9jyipgxe19OcubqV5w
April 1, 2024
203576
Mozambique
MOZ
true
2
1
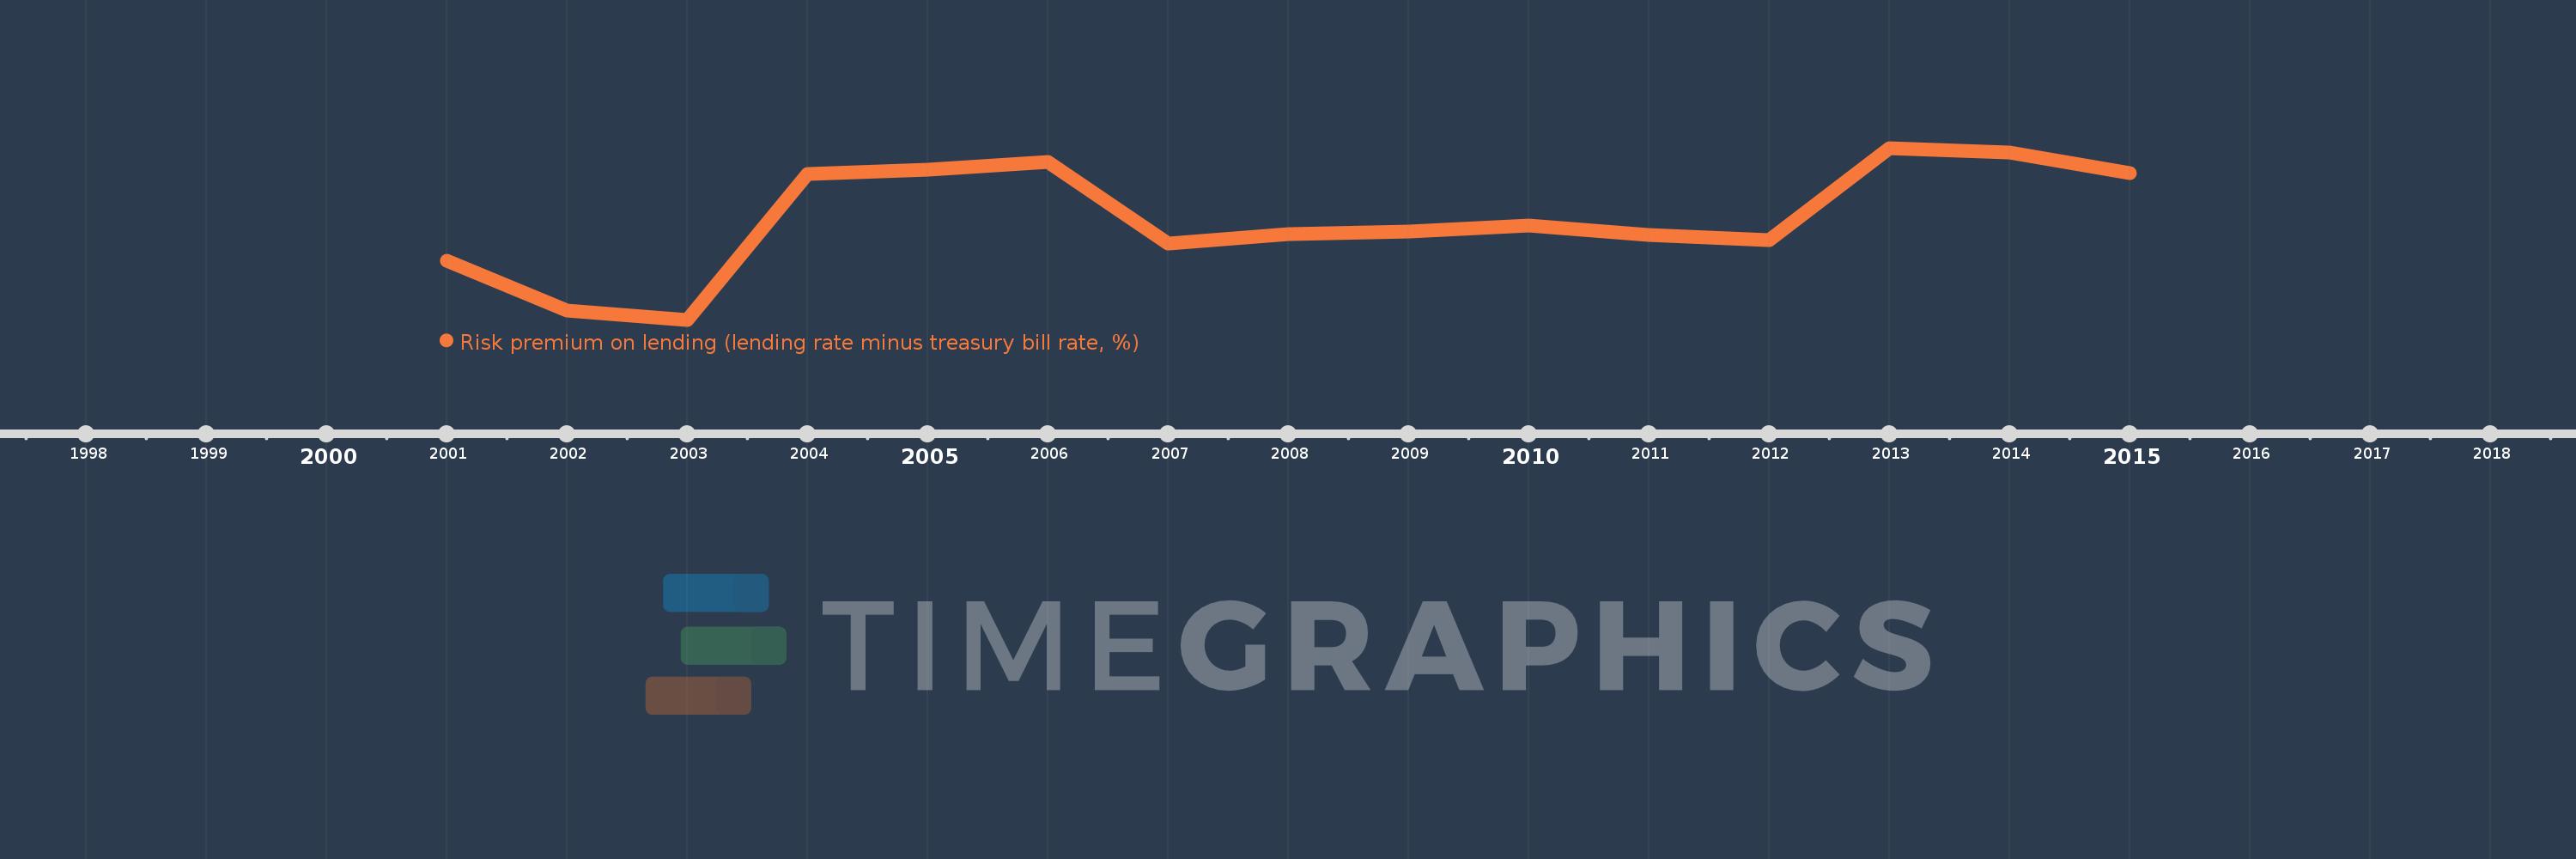
Risk premium on lending (lending rate minus treasury bill rate, %)
2015,2014,2013,2012,2011,2010,2009,2008,2007,2006,2005,2004,2003,2002,2001
This statistics in other country:
Timeline:
This timeline shows a graph from 2001 to 2015 of Mozambique. No data until 2000. Number of actual observations by date: 15.
Source name:
World Development Indicators
Source organization:
International Monetary Fund, International Financial Statistics database.
Categories, topics:
Financial Sector
Last updated:
apr 23, 2017
Indicators value changes by year
Minimum:
-2.838
jan 1, 2003
Maximum:
11.544
jan 1, 2013
At the date of observation
Value
Absolute change
Change from previous value
jan 1, 2001
2.07
+2.07
0.0%
jan 1, 2002
-2.044
-4.114
-198.72%
jan 1, 2003
-2.838
-0.794
38.86%
jan 1, 2004
9.375
+12.213
-430.35%
jan 1, 2005
9.709
+0.333
3.56%
jan 1, 2006
10.371
+0.662
6.82%
jan 1, 2007
3.51
-6.861
-66.15%
jan 1, 2008
4.356
+0.845
24.08%
jan 1, 2009
4.55
+0.194
4.46%
jan 1, 2010
5.085
+0.535
11.76%
jan 1, 2011
4.27
-0.815
-16.02%
jan 1, 2012
3.858
-0.412
-9.65%
jan 1, 2013
11.544
+7.686
199.21%
jan 1, 2014
11.195
-0.349
-3.03%
jan 1, 2015
9.471
-1.724
-15.4%
Ranking of countries by current statistics by years


Comments: