29
/
en
AIzaSyAYiBZKx7MnpbEhh9jyipgxe19OcubqV5w
April 1, 2024
205799
Namibia
NAM
true
2
1
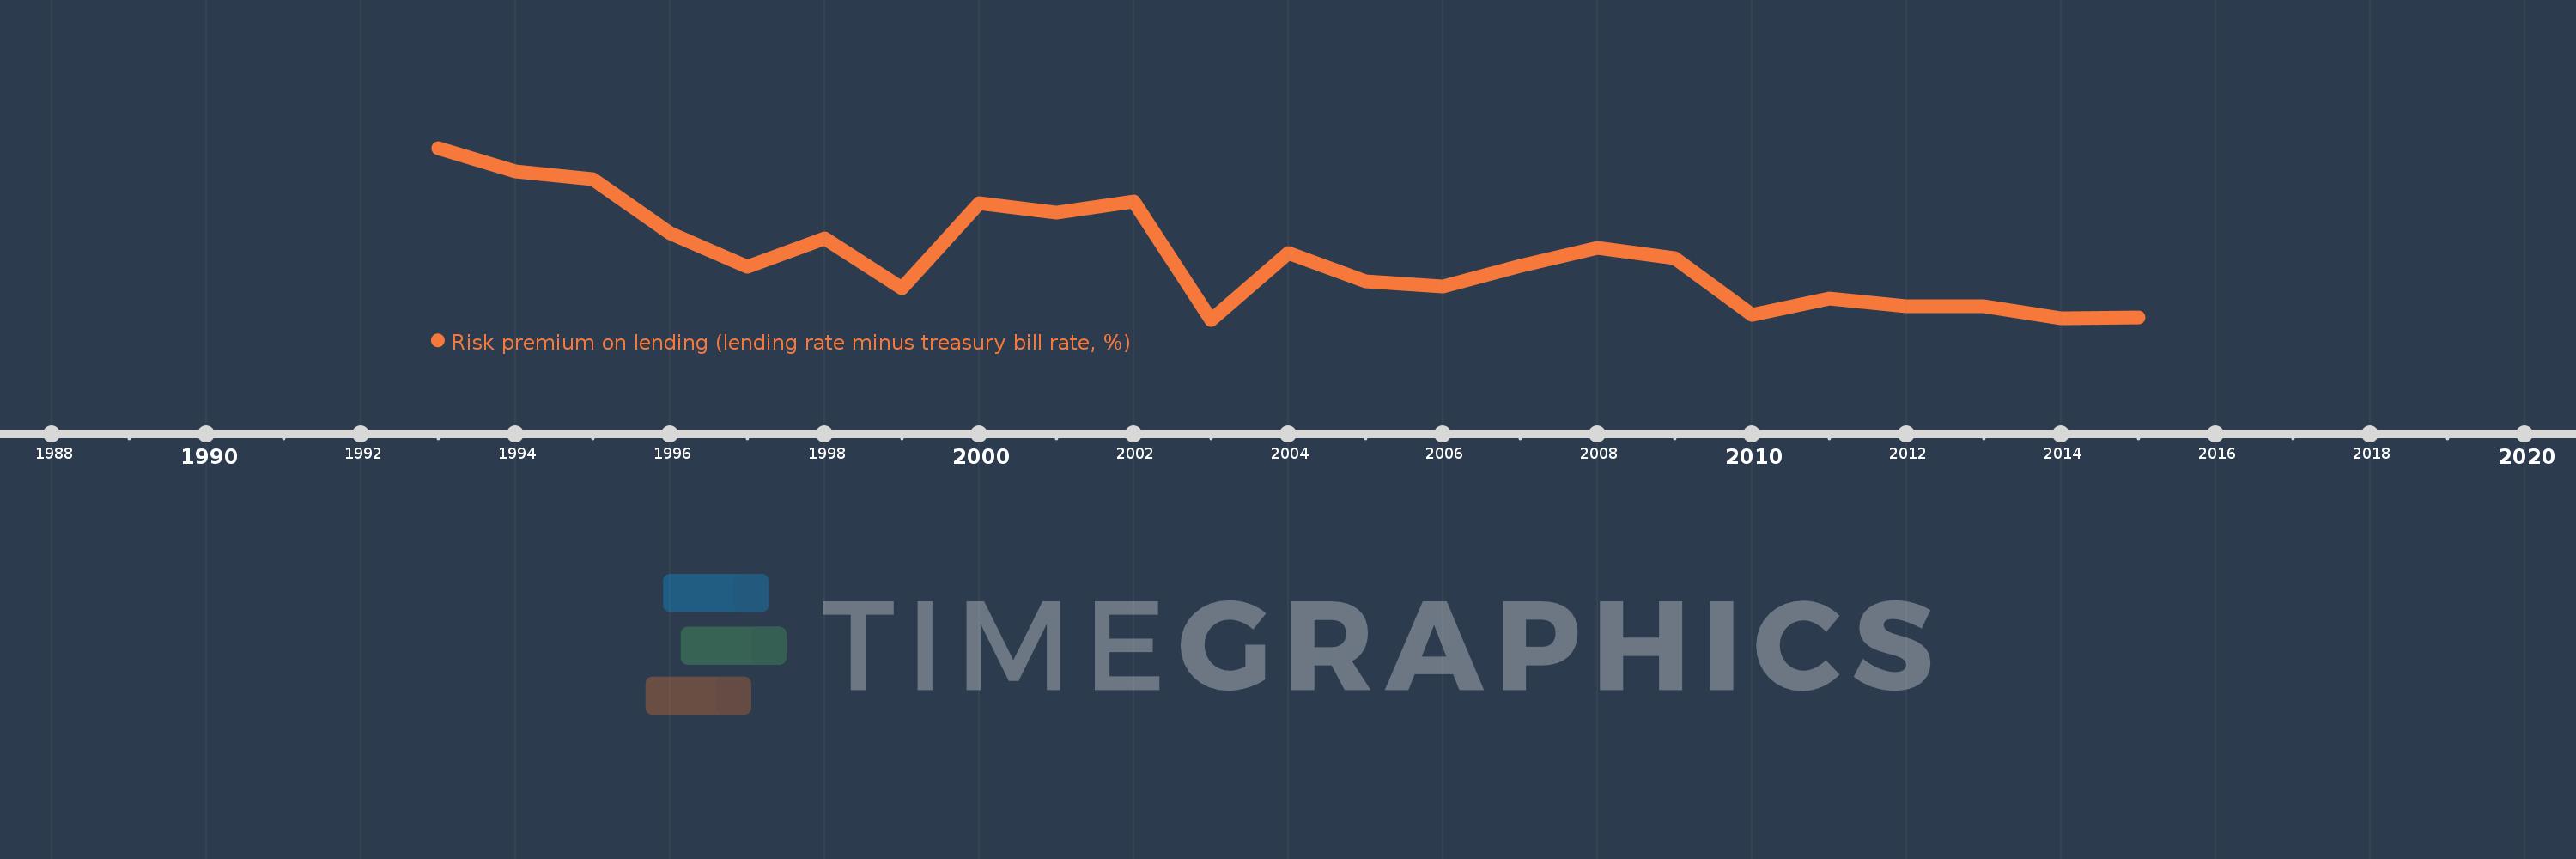
Risk premium on lending (lending rate minus treasury bill rate, %)
2015,2014,2013,2012,2011,2010,2009,2008,2007,2006,2005,2004,2003,2002,2001,2000,1999,1998,1997,1996,1995,1994,1993
This statistics in other country:
Timeline:
This timeline shows a graph from 1993 to 2015 of Namibia. No data until 1992. Number of actual observations by date: 23.
Source name:
World Development Indicators
Source organization:
International Monetary Fund, International Financial Statistics database.
Categories, topics:
Financial Sector
Last updated:
apr 23, 2017
Indicators value changes by year
At the date of observation
Value
Absolute change
Change from previous value
jan 1, 1993
6.334
+6.334
0.0%
jan 1, 1994
5.862
-0.473
-7.46%
jan 1, 1995
5.702
-0.16
-2.73%
jan 1, 1996
4.594
-1.107
-19.42%
jan 1, 1997
3.915
-0.679
-14.78%
jan 1, 1998
4.489
+0.574
14.67%
jan 1, 1999
3.482
-1.007
-22.42%
jan 1, 2000
5.208
+1.726
49.56%
jan 1, 2001
5.014
-0.194
-3.73%
jan 1, 2002
5.247
+0.233
4.64%
jan 1, 2003
2.835
-2.412
-45.97%
jan 1, 2004
4.189
+1.354
47.77%
jan 1, 2005
3.614
-0.575
-13.73%
jan 1, 2006
3.519
-0.095
-2.63%
jan 1, 2007
3.925
+0.406
11.53%
jan 1, 2008
4.293
+0.368
9.38%
jan 1, 2009
4.098
-0.195
-4.54%
jan 1, 2010
2.929
-1.169
-28.53%
jan 1, 2011
3.26
+0.331
11.29%
jan 1, 2012
3.108
-0.152
-4.67%
jan 1, 2013
3.107
-0.001
-0.02%
jan 1, 2014
2.864
-0.243
-7.81%
jan 1, 2015
2.886
+0.021
0.73%
Ranking of countries by current statistics by years


Comments: