29
/
en
AIzaSyAYiBZKx7MnpbEhh9jyipgxe19OcubqV5w
April 1, 2024
229149
Romania
ROU
true
2
1
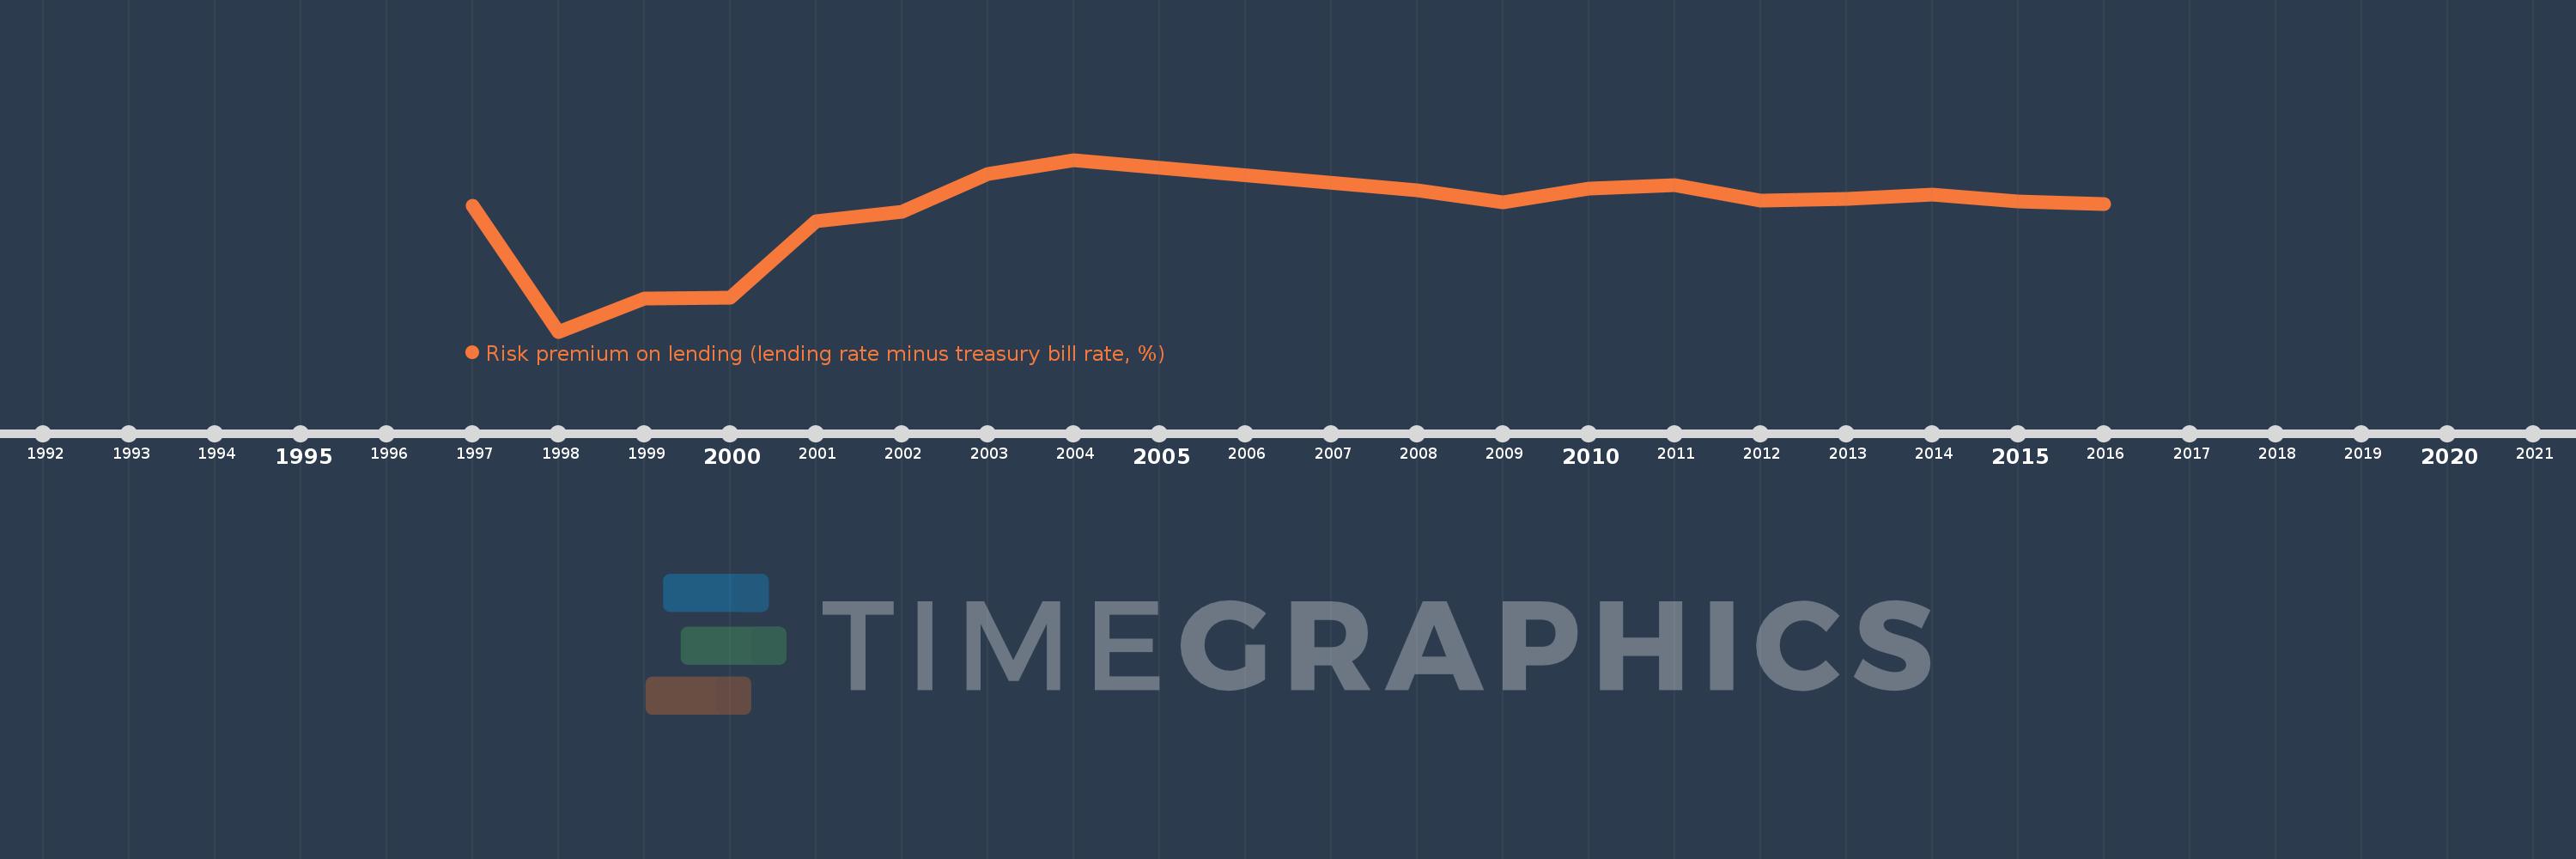
Risk premium on lending (lending rate minus treasury bill rate, %)
2016,2015,2014,2013,2012,2011,2010,2009,2008,2004,2003,2002,2001,2000,1999,1998,1997
This statistics in other country:
Timeline:
This timeline shows a graph from 1997 to 2016 of Romania. No data until 1996. Number of actual observations by date: 17.
Source name:
World Development Indicators
Source organization:
International Monetary Fund, International Financial Statistics database.
Categories, topics:
Financial Sector
Last updated:
apr 23, 2017
Indicators value changes by year
Minimum:
-13.193
jan 1, 1998
Maximum:
10.368
jan 1, 2004
At the date of observation
Value
Absolute change
Change from previous value
jan 1, 1997
4.04
+4.04
0.0%
jan 1, 1998
-13.193
-17.233
-426.57%
jan 1, 1999
-8.67
+4.523
-34.28%
jan 1, 2000
-8.567
+0.103
-1.19%
jan 1, 2001
1.992
+10.558
-123.25%
jan 1, 2002
3.217
+1.225
61.51%
jan 1, 2003
8.4
+5.183
161.14%
jan 1, 2004
10.368
+1.968
23.43%
jan 1, 2008
6.239
-4.129
-39.82%
jan 1, 2009
4.567
-1.672
-26.79%
jan 1, 2010
6.378
+1.811
39.65%
jan 1, 2011
6.862
+0.483
7.58%
jan 1, 2012
4.81
-2.052
-29.9%
jan 1, 2013
5.06
+0.25
5.21%
jan 1, 2014
5.631
+0.57
11.27%
jan 1, 2015
4.605
-1.026
-18.22%
jan 1, 2016
4.304
-0.301
-6.53%
Ranking of countries by current statistics by years


Comments: