29
/
en
AIzaSyAYiBZKx7MnpbEhh9jyipgxe19OcubqV5w
April 1, 2024
141080
Ghana
GHA
true
2
1
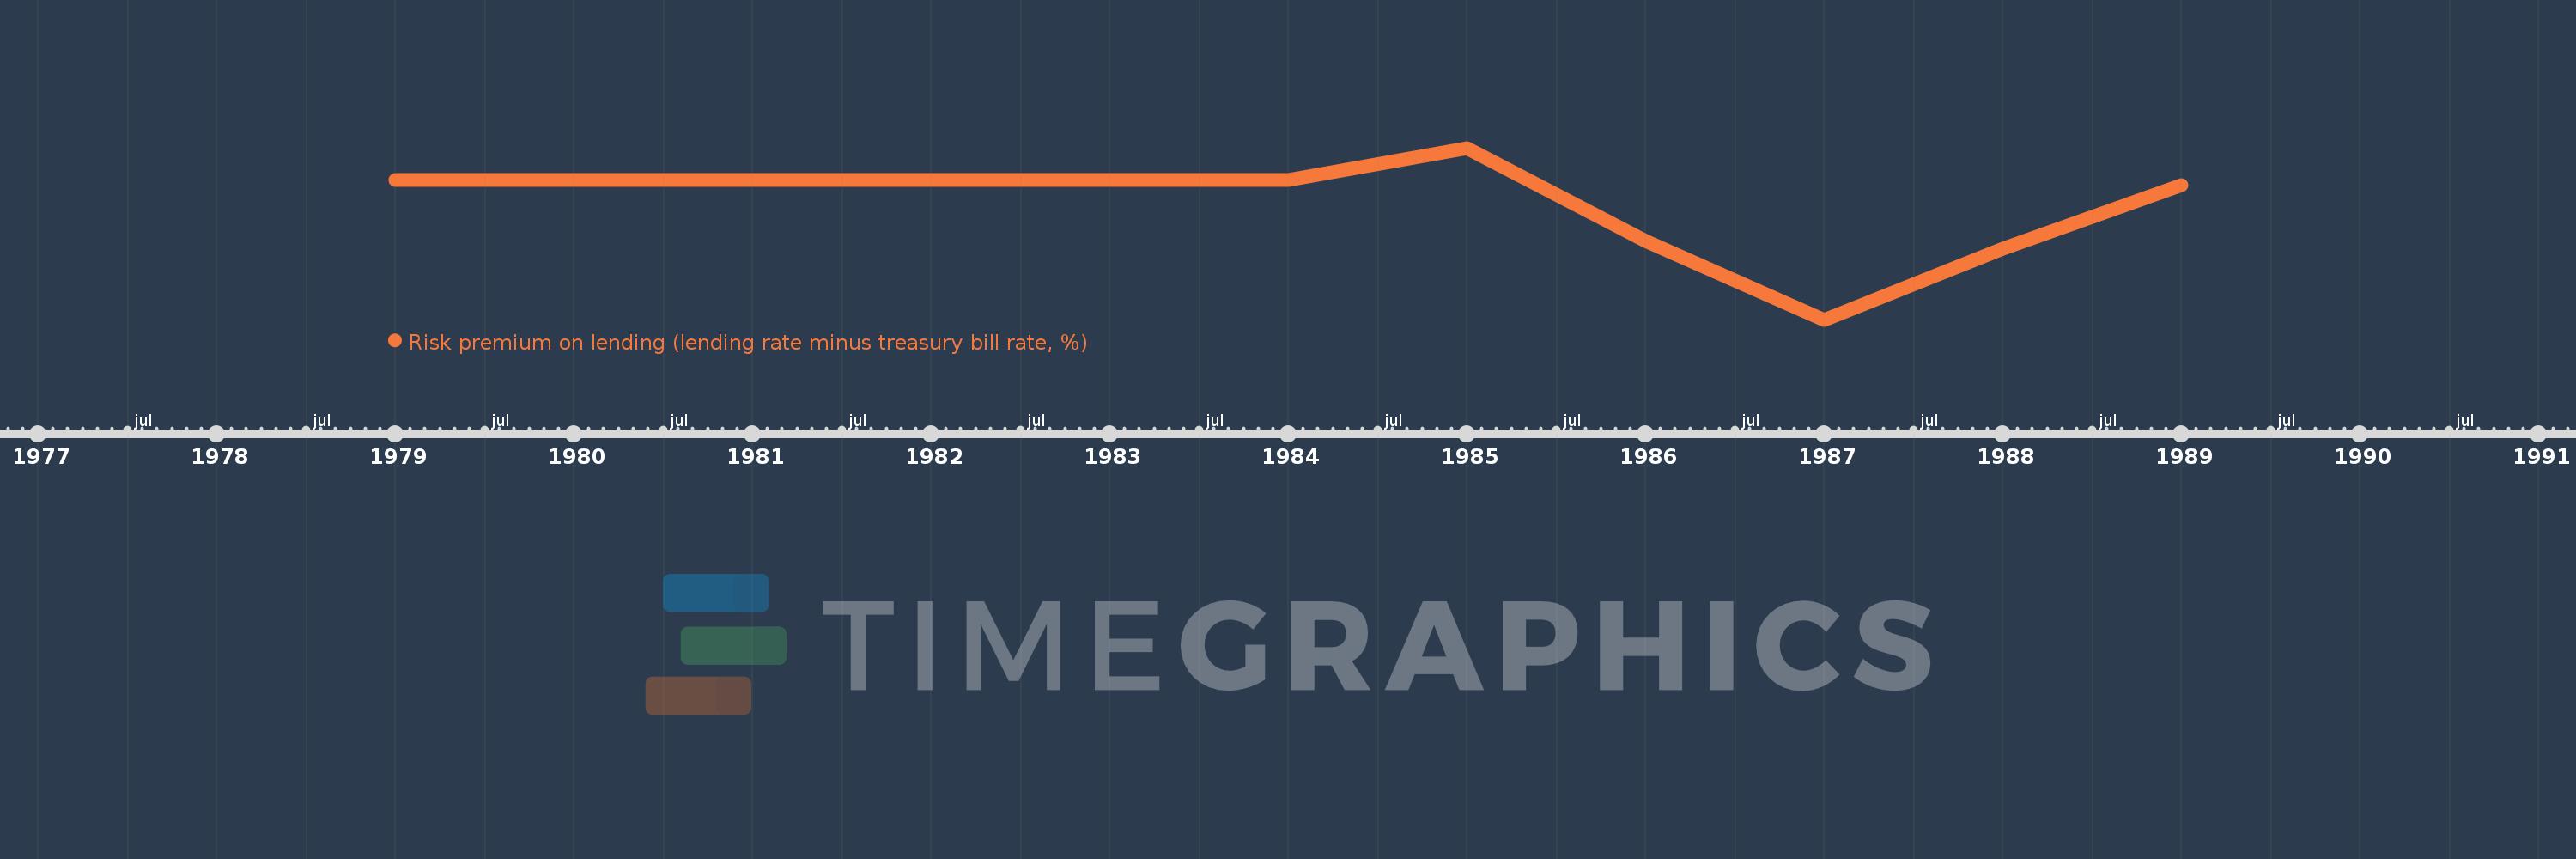
Risk premium on lending (lending rate minus treasury bill rate, %)
1989,1988,1987,1986,1985,1984,1983,1982,1981,1980,1979
This statistics in other country:
Timeline:
This timeline shows a graph from 1979 to 1989 of Ghana. No data until 1978. Number of actual observations by date: 11.
Source name:
World Development Indicators
Source organization:
International Monetary Fund, International Financial Statistics database.
Categories, topics:
Financial Sector
Last updated:
apr 23, 2017
Indicators value changes by year
At the date of observation
Value
Absolute change
Change from previous value
jan 1, 1985
7.008
+1.008
16.81%
jan 1, 1986
4.033
-2.975
-42.45%
jan 1, 1987
1.533
-2.5
-61.98%
jan 1, 1988
3.788
+2.254
147.01%
jan 1, 1989
5.827
+2.04
53.86%
Ranking of countries by current statistics by years


Comments: