29
/pt/
pt
AIzaSyAYiBZKx7MnpbEhh9jyipgxe19OcubqV5w
April 1, 2024
92085
British Virgin Islands
VGB
true
2
1
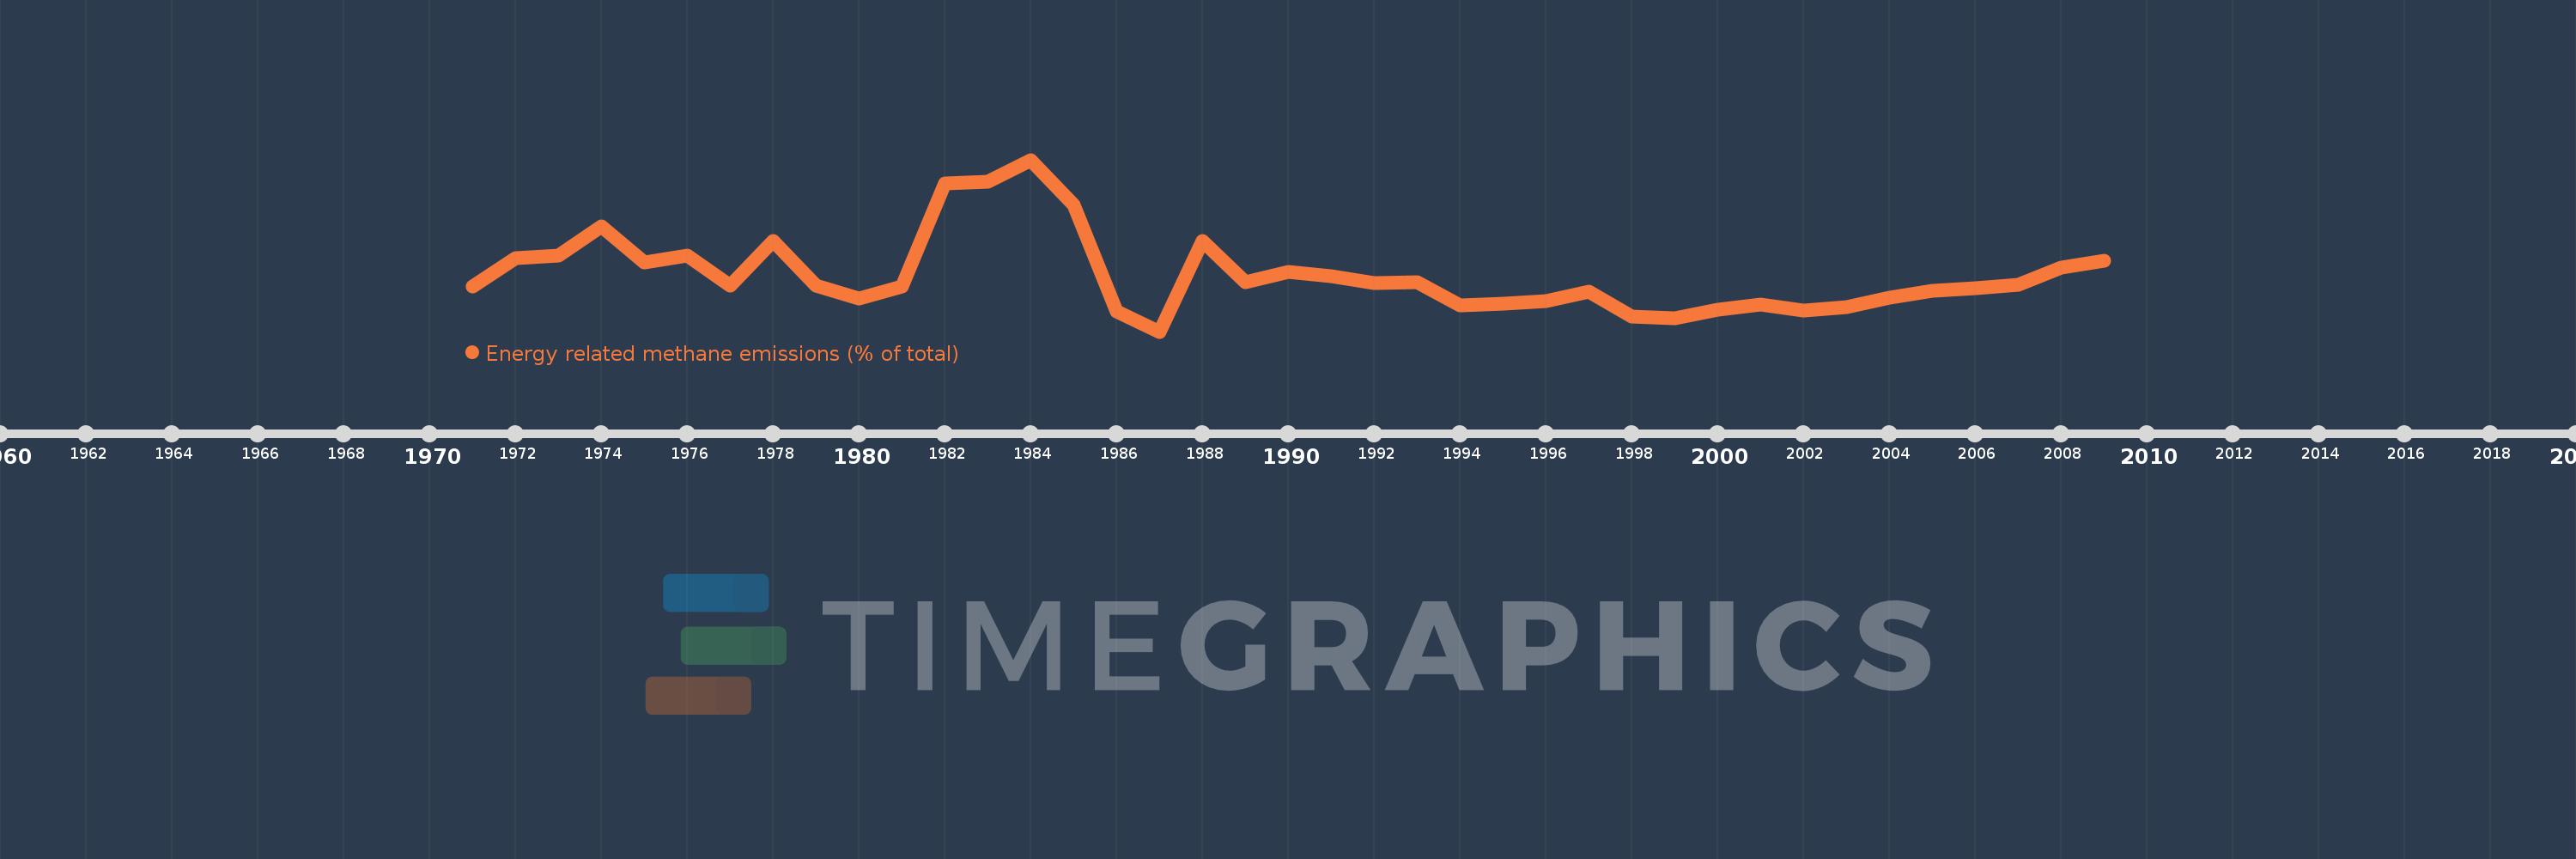
Energy related methane emissions (% of total)
2009,2008,2007,2006,2005,2004,2003,2002,2001,2000,1999,1998,1997,1996,1995,1994,1993,1992,1991,1990,1989,1988,1987,1986,1985,1984,1983,1982,1981,1980,1979,1978,1977,1976,1975,1974,1973,1972,1971
Estas estatísticas em outros países:
AfghanistanAlbaniaAlgeriaAmerican SamoaAngolaAntigua and BarbudaArab WorldArgentinaArmeniaArubaAustraliaAustriaAzerbaijanBahamas, TheBahrainBangladeshBarbadosBelarusBelgiumBelizeBeninBermudaBhutanBoliviaBosnia and HerzegovinaBotswanaBrazilBritish Virgin IslandsBrunei DarussalamBulgariaBurkina FasoBurundiCabo VerdeCambodiaCameroonCanadaCaribbean small statesCayman IslandsCentral African RepublicCentral Europe and the BalticsChadChileChinaColombiaComorosCongo, Dem. Rep.Congo, Rep.Costa RicaCote d'IvoireCroatiaCubaCyprusCzech RepublicDenmarkDjiboutiDominicaDominican RepublicEarly-demographic dividendEast Asia & PacificEast Asia & Pacific (excluding high income)East Asia & Pacific (IDA & IBRD countries)EcuadorEgypt, Arab Rep.El SalvadorEquatorial GuineaEritreaEstoniaEthiopiaEuro areaEurope & Central AsiaEurope & Central Asia (excluding high income)Europe & Central Asia (IDA & IBRD countries)European UnionFaroe IslandsFijiFinlandFragile and conflict affected situationsFranceFrench PolynesiaGabonGambia, TheGeorgiaGermanyGhanaGibraltarGreeceGreenlandGrenadaGuamGuatemalaGuineaGuinea-BissauGuyanaHaitiHeavily indebted poor countries (HIPC)High incomeHondurasHong Kong SAR, ChinaHungaryIBRD onlyIcelandIDA & IBRD totalIDA blendIDA onlyIDA totalIndiaIndonesiaIran, Islamic Rep.IraqIrelandIsraelItalyJamaicaJapanJordanKazakhstanKenyaKiribatiKorea, Dem. People’s Rep.Korea, Rep.KuwaitKyrgyz RepublicLao PDRLate-demographic dividendLatin America & Caribbean Latin America & Caribbean (excluding high income)Latin America & the Caribbean (IDA & IBRD countries)LatviaLeast developed countries: UN classificationLebanonLesothoLiberiaLibyaLithuaniaLow & middle incomeLow incomeLower middle incomeLuxembourgMacao SAR, ChinaMacedonia, FYRMadagascarMalawiMalaysiaMaldivesMaliMaltaMarshall IslandsMauritaniaMauritiusMexicoMicronesia, Fed. Sts.Middle East & North AfricaMiddle East & North Africa (excluding high income)Middle East & North Africa (IDA & IBRD countries)Middle incomeMoldovaMongoliaMoroccoMozambiqueMyanmarNamibiaNauruNepalNetherlandsNew CaledoniaNew ZealandNicaraguaNigerNigeriaNorth AmericaNorthern Mariana IslandsNorwayOECD membersOmanOther small statesPacific island small statesPakistanPalauPanamaPapua New GuineaParaguayPeruPhilippinesPolandPortugalPost-demographic dividendPre-demographic dividendPuerto RicoQatarRomaniaRussian FederationRwandaSamoaSao Tome and PrincipeSaudi ArabiaSenegalSerbiaSeychellesSierra LeoneSingaporeSlovak RepublicSloveniaSmall statesSolomon IslandsSomaliaSouth AfricaSouth AsiaSouth Asia (IDA & IBRD)SpainSri LankaSt. Kitts and NevisSt. LuciaSt. Vincent and the GrenadinesSub-Saharan Africa Sub-Saharan Africa (excluding high income)Sub-Saharan Africa (IDA & IBRD countries)SudanSurinameSwazilandSwedenSwitzerlandSyrian Arab RepublicTajikistanTanzaniaThailandTimor-LesteTogoTongaTrinidad and TobagoTunisiaTurkeyTurkmenistanTurks and Caicos IslandsTuvaluUgandaUkraineUnited Arab EmiratesUnited KingdomUnited StatesUpper middle incomeUruguayUzbekistanVanuatuVenezuela, RBVietnamVirgin Islands (U.S.)WorldYemen, Rep.ZambiaZimbabwe Linha do tempo:
Nesta escala de tempo está apresentado um gráfico de 1971 ano até 2009 ano British Virgin Islands. Dados de 1970 ano ausente. O número de observações reais por data: 39.
Fonte (nome):
Indicadores de desenvolvimento mundial
Fonte (organização):
World Bank staff estimates from original source: European Commission, Joint Research Centre (JRC)/Netherlands Environmental Assessment Agency (PBL). Emission Database for Global Atmospheric Research (EDGAR): http://edgar.jrc.ec.europa.eu/.
Categorias:
Energy & Mining, Environment
Foi atualizado:
23 abr 2017 ano
Indicadores de alterações dos valores ao longo dos anos
Mínimo:
1.375
1 jan 1987 ano
Máximo:
3.066
1 jan 1984 ano
Na data de observação
Valor
Mudança absoluta
A alteração em relação ao valor anterior
1 jan 1971 ano
1.817
+1.817
0.0%
1 jan 1972 ano
2.101
+0.284
15.63%
1 jan 1973 ano
2.125
+0.025
1.18%
1 jan 1974 ano
2.412
+0.286
13.47%
1 jan 1975 ano
2.059
-0.353
-14.63%
1 jan 1976 ano
2.123
+0.064
3.13%
1 jan 1977 ano
1.825
-0.298
-14.06%
1 jan 1978 ano
2.269
+0.444
24.34%
1 jan 1979 ano
1.826
-0.443
-19.53%
1 jan 1980 ano
1.703
-0.123
-6.75%
1 jan 1981 ano
1.816
+0.113
6.66%
1 jan 1982 ano
2.832
+1.016
55.93%
1 jan 1983 ano
2.851
+0.019
0.67%
1 jan 1984 ano
3.066
+0.215
7.54%
1 jan 1985 ano
2.619
-0.447
-14.57%
1 jan 1986 ano
1.574
-1.045
-39.92%
1 jan 1987 ano
1.375
-0.198
-12.61%
1 jan 1988 ano
2.264
+0.889
64.64%
1 jan 1989 ano
1.859
-0.405
-17.89%
1 jan 1990 ano
1.961
+0.102
5.49%
1 jan 1991 ano
1.92
-0.041
-2.11%
1 jan 1992 ano
1.856
-0.063
-3.29%
1 jan 1993 ano
1.863
+0.007
0.36%
1 jan 1994 ano
1.636
-0.227
-12.18%
1 jan 1995 ano
1.65
+0.014
0.83%
1 jan 1996 ano
1.676
+0.026
1.61%
1 jan 1997 ano
1.772
+0.096
5.74%
1 jan 1998 ano
1.52
-0.252
-14.22%
1 jan 1999 ano
1.507
-0.013
-0.85%
1 jan 2000 ano
1.588
+0.08
5.33%
1 jan 2001 ano
1.643
+0.056
3.5%
1 jan 2002 ano
1.585
-0.059
-3.57%
1 jan 2003 ano
1.615
+0.031
1.94%
1 jan 2004 ano
1.707
+0.092
5.68%
1 jan 2005 ano
1.779
+0.072
4.22%
1 jan 2006 ano
1.8
+0.021
1.15%
1 jan 2007 ano
1.836
+0.037
2.04%
1 jan 2008 ano
2.009
+0.173
9.41%
1 jan 2009 ano
2.069
+0.06
2.98%
Classificação de países por estatísticas atuais por anos


Comentários: