29
/pt/
pt
AIzaSyAYiBZKx7MnpbEhh9jyipgxe19OcubqV5w
April 1, 2024
29800
Euro area
EMU
false
2
1
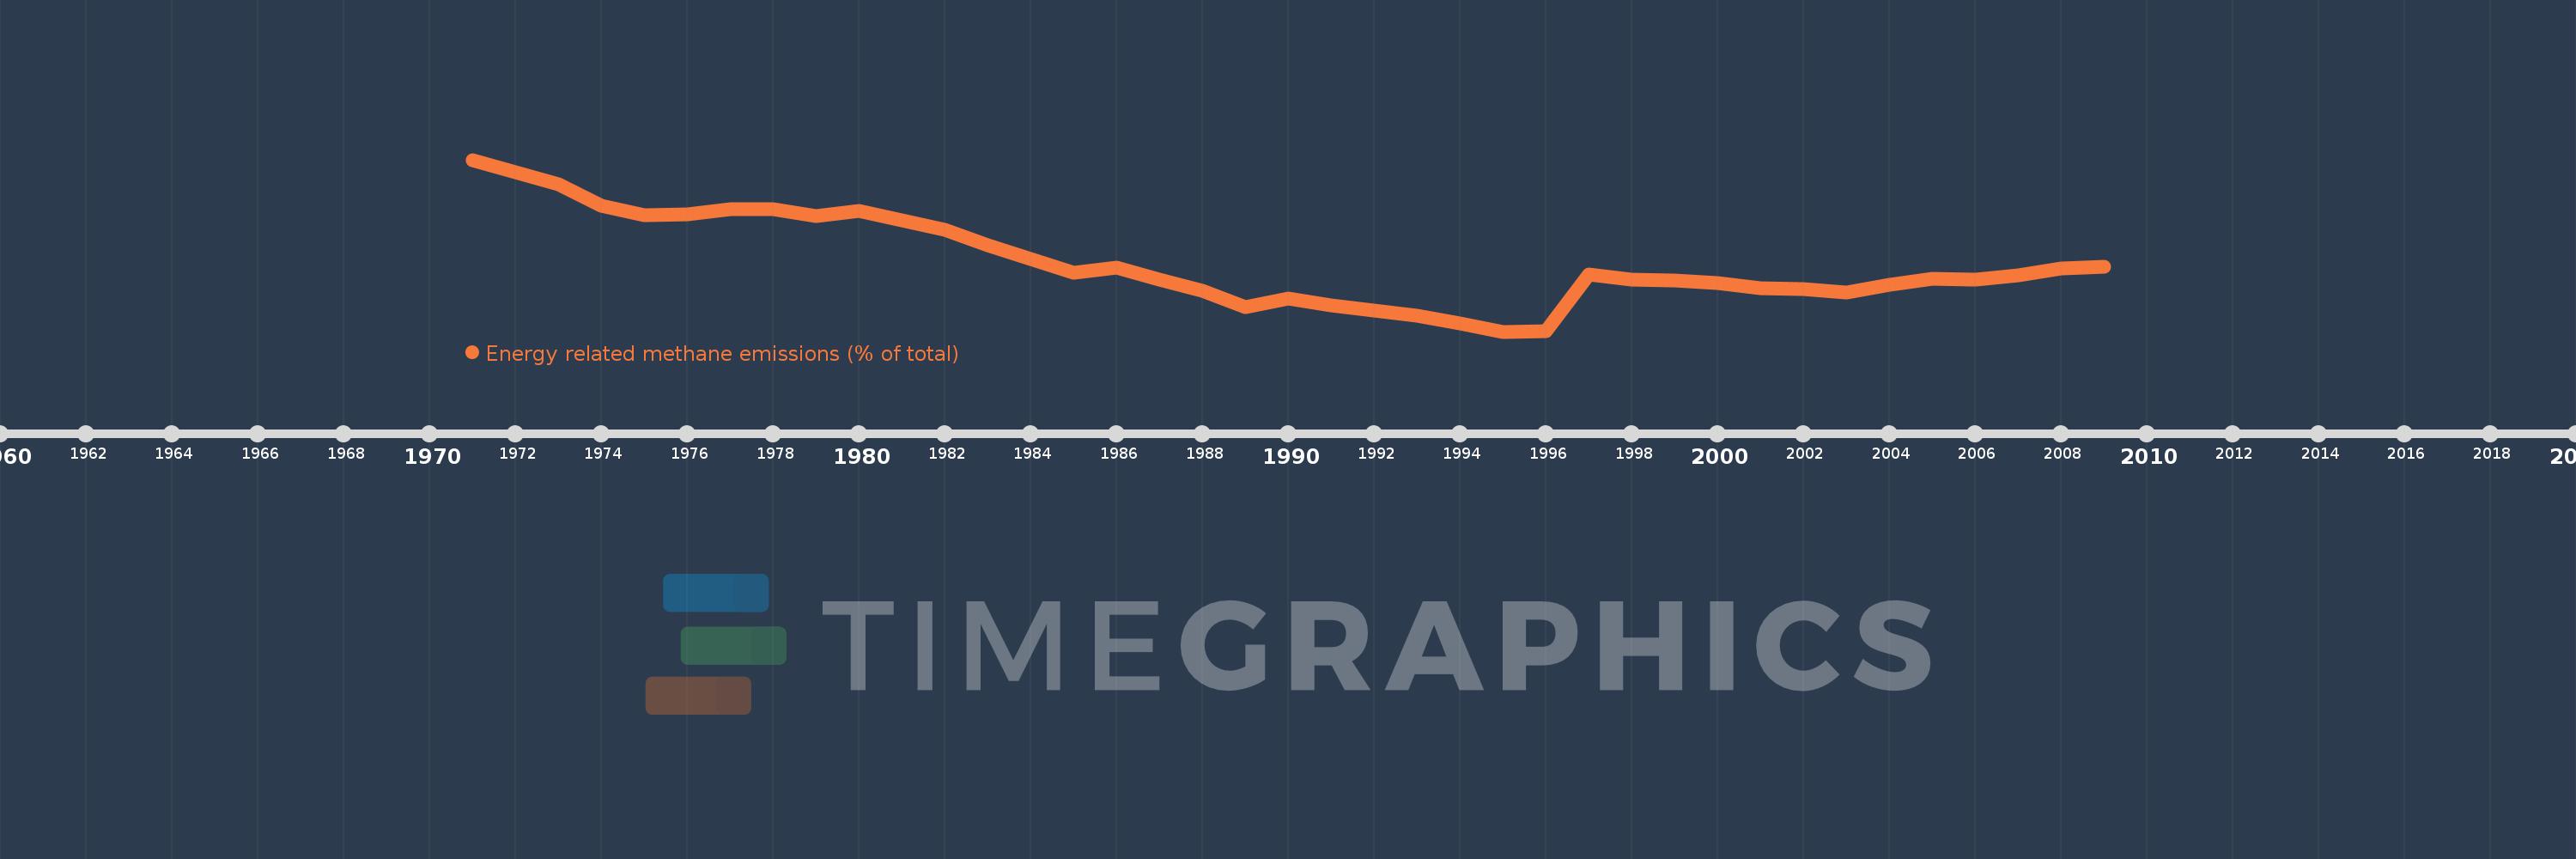
Energy related methane emissions (% of total)
2009,2008,2007,2006,2005,2004,2003,2002,2001,2000,1999,1998,1997,1996,1995,1994,1993,1992,1991,1990,1989,1988,1987,1986,1985,1984,1983,1982,1981,1980,1979,1978,1977,1976,1975,1974,1973,1972,1971
Estas estatísticas em outros países:
AfghanistanAlbaniaAlgeriaAmerican SamoaAngolaAntigua and BarbudaArab WorldArgentinaArmeniaArubaAustraliaAustriaAzerbaijanBahamas, TheBahrainBangladeshBarbadosBelarusBelgiumBelizeBeninBermudaBhutanBoliviaBosnia and HerzegovinaBotswanaBrazilBritish Virgin IslandsBrunei DarussalamBulgariaBurkina FasoBurundiCabo VerdeCambodiaCameroonCanadaCaribbean small statesCayman IslandsCentral African RepublicCentral Europe and the BalticsChadChileChinaColombiaComorosCongo, Dem. Rep.Congo, Rep.Costa RicaCote d'IvoireCroatiaCubaCyprusCzech RepublicDenmarkDjiboutiDominicaDominican RepublicEarly-demographic dividendEast Asia & PacificEast Asia & Pacific (excluding high income)East Asia & Pacific (IDA & IBRD countries)EcuadorEgypt, Arab Rep.El SalvadorEquatorial GuineaEritreaEstoniaEthiopiaEuro areaEurope & Central AsiaEurope & Central Asia (excluding high income)Europe & Central Asia (IDA & IBRD countries)European UnionFaroe IslandsFijiFinlandFragile and conflict affected situationsFranceFrench PolynesiaGabonGambia, TheGeorgiaGermanyGhanaGibraltarGreeceGreenlandGrenadaGuamGuatemalaGuineaGuinea-BissauGuyanaHaitiHeavily indebted poor countries (HIPC)High incomeHondurasHong Kong SAR, ChinaHungaryIBRD onlyIcelandIDA & IBRD totalIDA blendIDA onlyIDA totalIndiaIndonesiaIran, Islamic Rep.IraqIrelandIsraelItalyJamaicaJapanJordanKazakhstanKenyaKiribatiKorea, Dem. People’s Rep.Korea, Rep.KuwaitKyrgyz RepublicLao PDRLate-demographic dividendLatin America & Caribbean Latin America & Caribbean (excluding high income)Latin America & the Caribbean (IDA & IBRD countries)LatviaLeast developed countries: UN classificationLebanonLesothoLiberiaLibyaLithuaniaLow & middle incomeLow incomeLower middle incomeLuxembourgMacao SAR, ChinaMacedonia, FYRMadagascarMalawiMalaysiaMaldivesMaliMaltaMarshall IslandsMauritaniaMauritiusMexicoMicronesia, Fed. Sts.Middle East & North AfricaMiddle East & North Africa (excluding high income)Middle East & North Africa (IDA & IBRD countries)Middle incomeMoldovaMongoliaMoroccoMozambiqueMyanmarNamibiaNauruNepalNetherlandsNew CaledoniaNew ZealandNicaraguaNigerNigeriaNorth AmericaNorthern Mariana IslandsNorwayOECD membersOmanOther small statesPacific island small statesPakistanPalauPanamaPapua New GuineaParaguayPeruPhilippinesPolandPortugalPost-demographic dividendPre-demographic dividendPuerto RicoQatarRomaniaRussian FederationRwandaSamoaSao Tome and PrincipeSaudi ArabiaSenegalSerbiaSeychellesSierra LeoneSingaporeSlovak RepublicSloveniaSmall statesSolomon IslandsSomaliaSouth AfricaSouth AsiaSouth Asia (IDA & IBRD)SpainSri LankaSt. Kitts and NevisSt. LuciaSt. Vincent and the GrenadinesSub-Saharan Africa Sub-Saharan Africa (excluding high income)Sub-Saharan Africa (IDA & IBRD countries)SudanSurinameSwazilandSwedenSwitzerlandSyrian Arab RepublicTajikistanTanzaniaThailandTimor-LesteTogoTongaTrinidad and TobagoTunisiaTurkeyTurkmenistanTurks and Caicos IslandsTuvaluUgandaUkraineUnited Arab EmiratesUnited KingdomUnited StatesUpper middle incomeUruguayUzbekistanVanuatuVenezuela, RBVietnamVirgin Islands (U.S.)WorldYemen, Rep.ZambiaZimbabwe Linha do tempo:
Nesta escala de tempo está apresentado um gráfico de 1971 ano até 2009 ano Euro area. Dados de 1970 ano ausente. O número de observações reais por data: 39.
Fonte (nome):
Indicadores de desenvolvimento mundial
Fonte (organização):
World Bank staff estimates from original source: European Commission, Joint Research Centre (JRC)/Netherlands Environmental Assessment Agency (PBL). Emission Database for Global Atmospheric Research (EDGAR): http://edgar.jrc.ec.europa.eu/.
Categorias:
Energy & Mining, Environment
Foi atualizado:
23 abr 2017 ano
Indicadores de alterações dos valores ao longo dos anos
Mínimo:
22.222
1 jan 1995 ano
Máximo:
31.799
1 jan 1971 ano
Na data de observação
Valor
Mudança absoluta
A alteração em relação ao valor anterior
1 jan 1971 ano
31.799
+31.799
0.0%
1 jan 1972 ano
31.109
-0.69
-2.17%
1 jan 1973 ano
30.447
-0.662
-2.13%
1 jan 1974 ano
29.229
-1.218
-4.0%
1 jan 1975 ano
28.729
-0.5
-1.71%
1 jan 1976 ano
28.756
+0.027
0.09%
1 jan 1977 ano
29.051
+0.295
1.03%
1 jan 1978 ano
29.069
+0.018
0.06%
1 jan 1979 ano
28.643
-0.426
-1.46%
1 jan 1980 ano
28.927
+0.284
0.99%
1 jan 1981 ano
28.415
-0.512
-1.77%
1 jan 1982 ano
27.903
-0.512
-1.8%
1 jan 1983 ano
27.04
-0.863
-3.09%
1 jan 1984 ano
26.279
-0.761
-2.82%
1 jan 1985 ano
25.506
-0.773
-2.94%
1 jan 1986 ano
25.773
+0.266
1.04%
1 jan 1987 ano
25.114
-0.659
-2.56%
1 jan 1988 ano
24.512
-0.602
-2.4%
1 jan 1989 ano
23.606
-0.906
-3.7%
1 jan 1990 ano
24.042
+0.436
1.85%
1 jan 1991 ano
23.706
-0.336
-1.4%
1 jan 1992 ano
23.401
-0.305
-1.29%
1 jan 1993 ano
23.095
-0.306
-1.31%
1 jan 1994 ano
22.687
-0.408
-1.77%
1 jan 1995 ano
22.222
-0.464
-2.05%
1 jan 1996 ano
22.225
+0.003
0.01%
1 jan 1997 ano
25.398
+3.173
14.28%
1 jan 1998 ano
25.141
-0.257
-1.01%
1 jan 1999 ano
25.087
-0.054
-0.22%
1 jan 2000 ano
24.91
-0.176
-0.7%
1 jan 2001 ano
24.655
-0.255
-1.02%
1 jan 2002 ano
24.581
-0.074
-0.3%
1 jan 2003 ano
24.402
-0.179
-0.73%
1 jan 2004 ano
24.809
+0.407
1.67%
1 jan 2005 ano
25.183
+0.373
1.51%
1 jan 2006 ano
25.121
-0.062
-0.25%
1 jan 2007 ano
25.369
+0.248
0.99%
1 jan 2008 ano
25.718
+0.349
1.38%
1 jan 2009 ano
25.847
+0.129
0.5%
Classificação de países por estatísticas atuais por anos


Comentários: