29
/pt/
pt
AIzaSyAYiBZKx7MnpbEhh9jyipgxe19OcubqV5w
April 1, 2024
85068
Bermuda
BMU
true
2
1
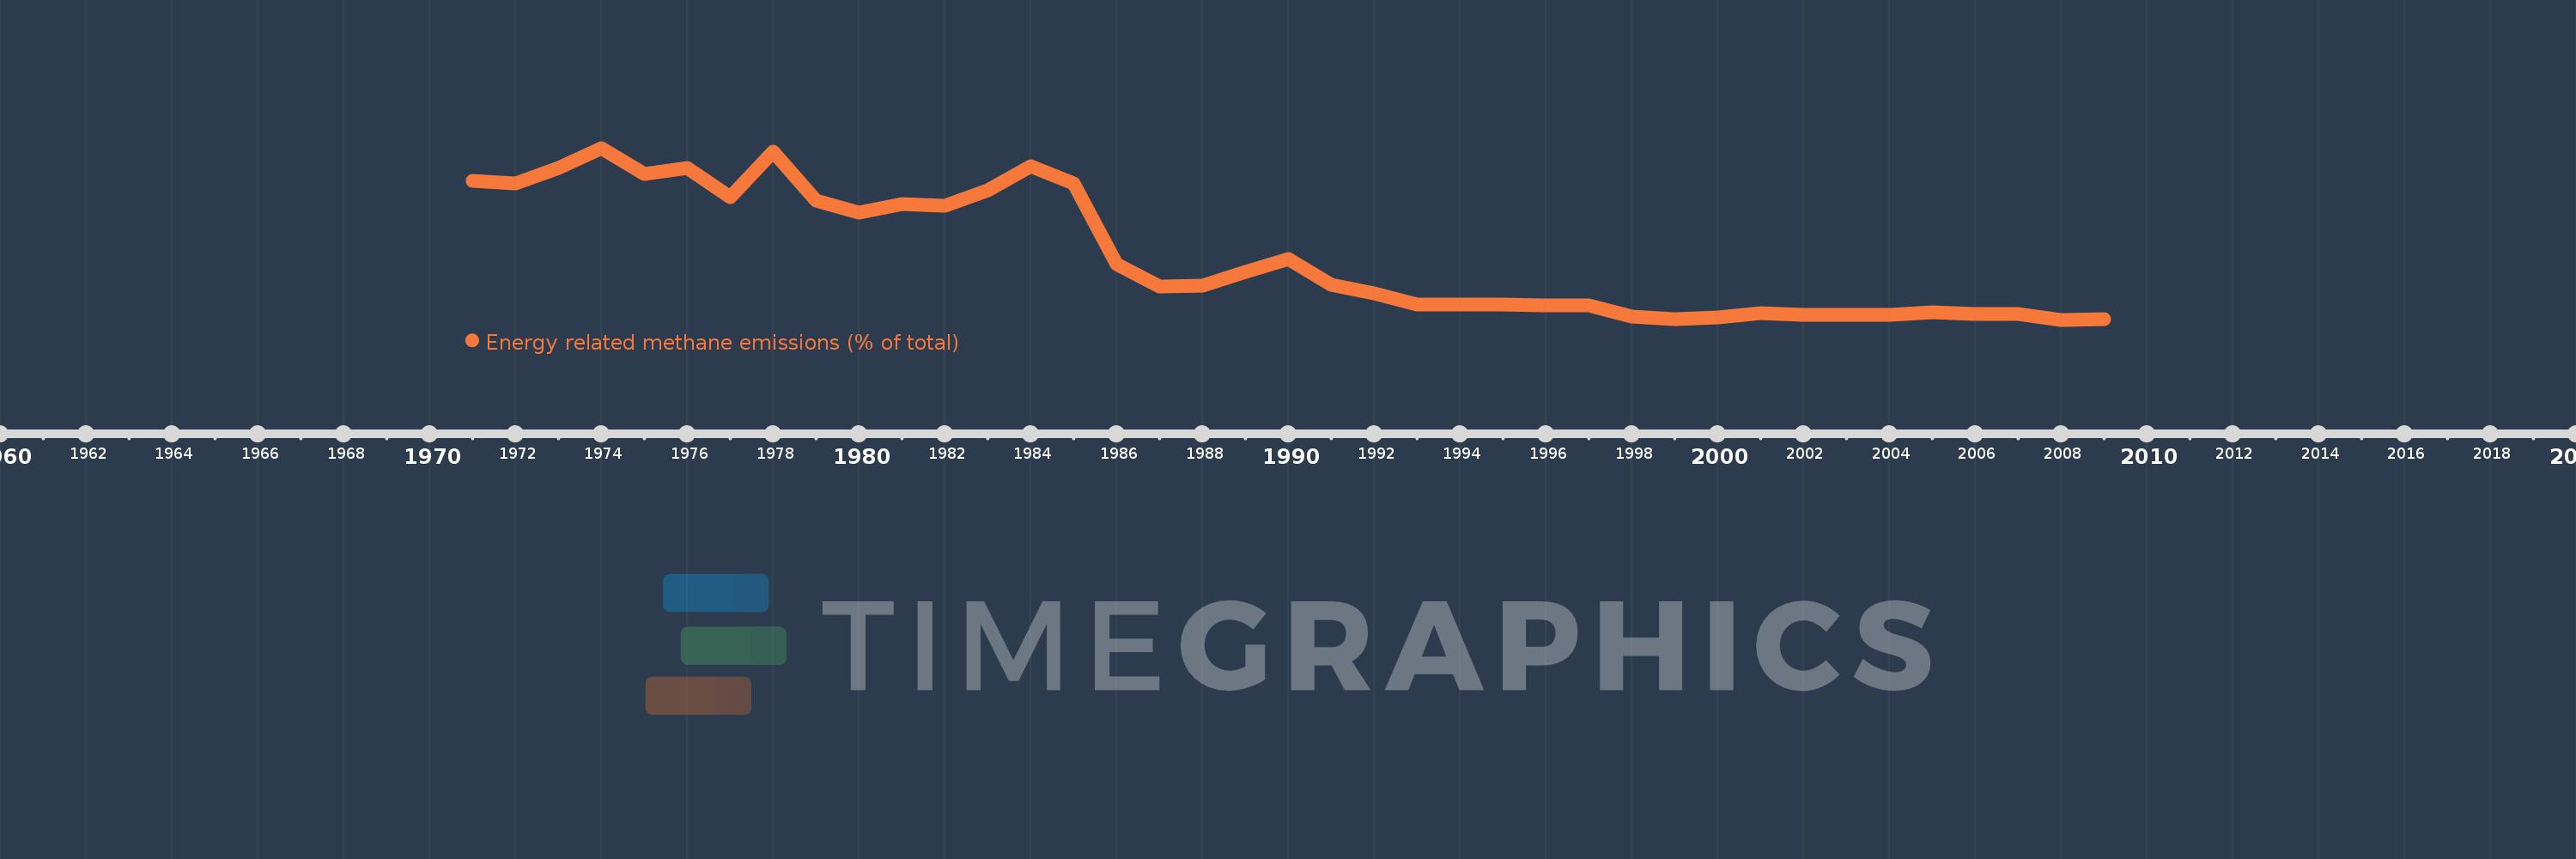
Energy related methane emissions (% of total)
2009,2008,2007,2006,2005,2004,2003,2002,2001,2000,1999,1998,1997,1996,1995,1994,1993,1992,1991,1990,1989,1988,1987,1986,1985,1984,1983,1982,1981,1980,1979,1978,1977,1976,1975,1974,1973,1972,1971
Estas estatísticas em outros países:
AfghanistanAlbaniaAlgeriaAmerican SamoaAngolaAntigua and BarbudaArab WorldArgentinaArmeniaArubaAustraliaAustriaAzerbaijanBahamas, TheBahrainBangladeshBarbadosBelarusBelgiumBelizeBeninBermudaBhutanBoliviaBosnia and HerzegovinaBotswanaBrazilBritish Virgin IslandsBrunei DarussalamBulgariaBurkina FasoBurundiCabo VerdeCambodiaCameroonCanadaCaribbean small statesCayman IslandsCentral African RepublicCentral Europe and the BalticsChadChileChinaColombiaComorosCongo, Dem. Rep.Congo, Rep.Costa RicaCote d'IvoireCroatiaCubaCyprusCzech RepublicDenmarkDjiboutiDominicaDominican RepublicEarly-demographic dividendEast Asia & PacificEast Asia & Pacific (excluding high income)East Asia & Pacific (IDA & IBRD countries)EcuadorEgypt, Arab Rep.El SalvadorEquatorial GuineaEritreaEstoniaEthiopiaEuro areaEurope & Central AsiaEurope & Central Asia (excluding high income)Europe & Central Asia (IDA & IBRD countries)European UnionFaroe IslandsFijiFinlandFragile and conflict affected situationsFranceFrench PolynesiaGabonGambia, TheGeorgiaGermanyGhanaGibraltarGreeceGreenlandGrenadaGuamGuatemalaGuineaGuinea-BissauGuyanaHaitiHeavily indebted poor countries (HIPC)High incomeHondurasHong Kong SAR, ChinaHungaryIBRD onlyIcelandIDA & IBRD totalIDA blendIDA onlyIDA totalIndiaIndonesiaIran, Islamic Rep.IraqIrelandIsraelItalyJamaicaJapanJordanKazakhstanKenyaKiribatiKorea, Dem. People’s Rep.Korea, Rep.KuwaitKyrgyz RepublicLao PDRLate-demographic dividendLatin America & Caribbean Latin America & Caribbean (excluding high income)Latin America & the Caribbean (IDA & IBRD countries)LatviaLeast developed countries: UN classificationLebanonLesothoLiberiaLibyaLithuaniaLow & middle incomeLow incomeLower middle incomeLuxembourgMacao SAR, ChinaMacedonia, FYRMadagascarMalawiMalaysiaMaldivesMaliMaltaMarshall IslandsMauritaniaMauritiusMexicoMicronesia, Fed. Sts.Middle East & North AfricaMiddle East & North Africa (excluding high income)Middle East & North Africa (IDA & IBRD countries)Middle incomeMoldovaMongoliaMoroccoMozambiqueMyanmarNamibiaNauruNepalNetherlandsNew CaledoniaNew ZealandNicaraguaNigerNigeriaNorth AmericaNorthern Mariana IslandsNorwayOECD membersOmanOther small statesPacific island small statesPakistanPalauPanamaPapua New GuineaParaguayPeruPhilippinesPolandPortugalPost-demographic dividendPre-demographic dividendPuerto RicoQatarRomaniaRussian FederationRwandaSamoaSao Tome and PrincipeSaudi ArabiaSenegalSerbiaSeychellesSierra LeoneSingaporeSlovak RepublicSloveniaSmall statesSolomon IslandsSomaliaSouth AfricaSouth AsiaSouth Asia (IDA & IBRD)SpainSri LankaSt. Kitts and NevisSt. LuciaSt. Vincent and the GrenadinesSub-Saharan Africa Sub-Saharan Africa (excluding high income)Sub-Saharan Africa (IDA & IBRD countries)SudanSurinameSwazilandSwedenSwitzerlandSyrian Arab RepublicTajikistanTanzaniaThailandTimor-LesteTogoTongaTrinidad and TobagoTunisiaTurkeyTurkmenistanTurks and Caicos IslandsTuvaluUgandaUkraineUnited Arab EmiratesUnited KingdomUnited StatesUpper middle incomeUruguayUzbekistanVanuatuVenezuela, RBVietnamVirgin Islands (U.S.)WorldYemen, Rep.ZambiaZimbabwe Linha do tempo:
Nesta escala de tempo está apresentado um gráfico de 1971 ano até 2009 ano Bermuda. Dados de 1970 ano ausente. O número de observações reais por data: 39.
Fonte (nome):
Indicadores de desenvolvimento mundial
Fonte (organização):
World Bank staff estimates from original source: European Commission, Joint Research Centre (JRC)/Netherlands Environmental Assessment Agency (PBL). Emission Database for Global Atmospheric Research (EDGAR): http://edgar.jrc.ec.europa.eu/.
Categorias:
Energy & Mining, Environment
Foi atualizado:
23 abr 2017 ano
Indicadores de alterações dos valores ao longo dos anos
Mínimo:
3.693
1 jan 2008 ano
Máximo:
22.682
1 jan 1974 ano
Na data de observação
Valor
Mudança absoluta
A alteração em relação ao valor anterior
1 jan 1971 ano
19.082
+19.082
0.0%
1 jan 1972 ano
18.719
-0.363
-1.9%
1 jan 1973 ano
20.473
+1.753
9.37%
1 jan 1974 ano
22.682
+2.209
10.79%
1 jan 1975 ano
19.83
-2.852
-12.57%
1 jan 1976 ano
20.507
+0.677
3.41%
1 jan 1977 ano
17.252
-3.254
-15.87%
1 jan 1978 ano
22.246
+4.994
28.94%
1 jan 1979 ano
16.862
-5.384
-24.2%
1 jan 1980 ano
15.494
-1.368
-8.11%
1 jan 1981 ano
16.472
+0.978
6.31%
1 jan 1982 ano
16.318
-0.155
-0.94%
1 jan 1983 ano
17.978
+1.66
10.18%
1 jan 1984 ano
20.659
+2.681
14.91%
1 jan 1985 ano
18.77
-1.889
-9.14%
1 jan 1986 ano
9.808
-8.962
-47.75%
1 jan 1987 ano
7.388
-2.419
-24.67%
1 jan 1988 ano
7.426
+0.037
0.5%
1 jan 1989 ano
9.024
+1.598
21.52%
1 jan 1990 ano
10.453
+1.429
15.84%
1 jan 1991 ano
7.559
-2.894
-27.68%
1 jan 1992 ano
6.59
-0.97
-12.83%
1 jan 1993 ano
5.335
-1.255
-19.04%
1 jan 1994 ano
5.358
+0.023
0.44%
1 jan 1995 ano
5.33
-0.029
-0.53%
1 jan 1996 ano
5.286
-0.044
-0.83%
1 jan 1997 ano
5.243
-0.042
-0.8%
1 jan 1998 ano
4.075
-1.168
-22.28%
1 jan 1999 ano
3.736
-0.338
-8.31%
1 jan 2000 ano
3.963
+0.227
6.07%
1 jan 2001 ano
4.393
+0.43
10.85%
1 jan 2002 ano
4.259
-0.135
-3.06%
1 jan 2003 ano
4.252
-0.007
-0.16%
1 jan 2004 ano
4.238
-0.014
-0.34%
1 jan 2005 ano
4.555
+0.318
7.5%
1 jan 2006 ano
4.343
-0.212
-4.66%
1 jan 2007 ano
4.336
-0.007
-0.17%
1 jan 2008 ano
3.693
-0.642
-14.81%
1 jan 2009 ano
3.782
+0.089
2.4%
Classificação de países por estatísticas atuais por anos


Comentários: