29
/pt/
pt
AIzaSyAYiBZKx7MnpbEhh9jyipgxe19OcubqV5w
April 1, 2024
56168
Small states
SST
false
2
1
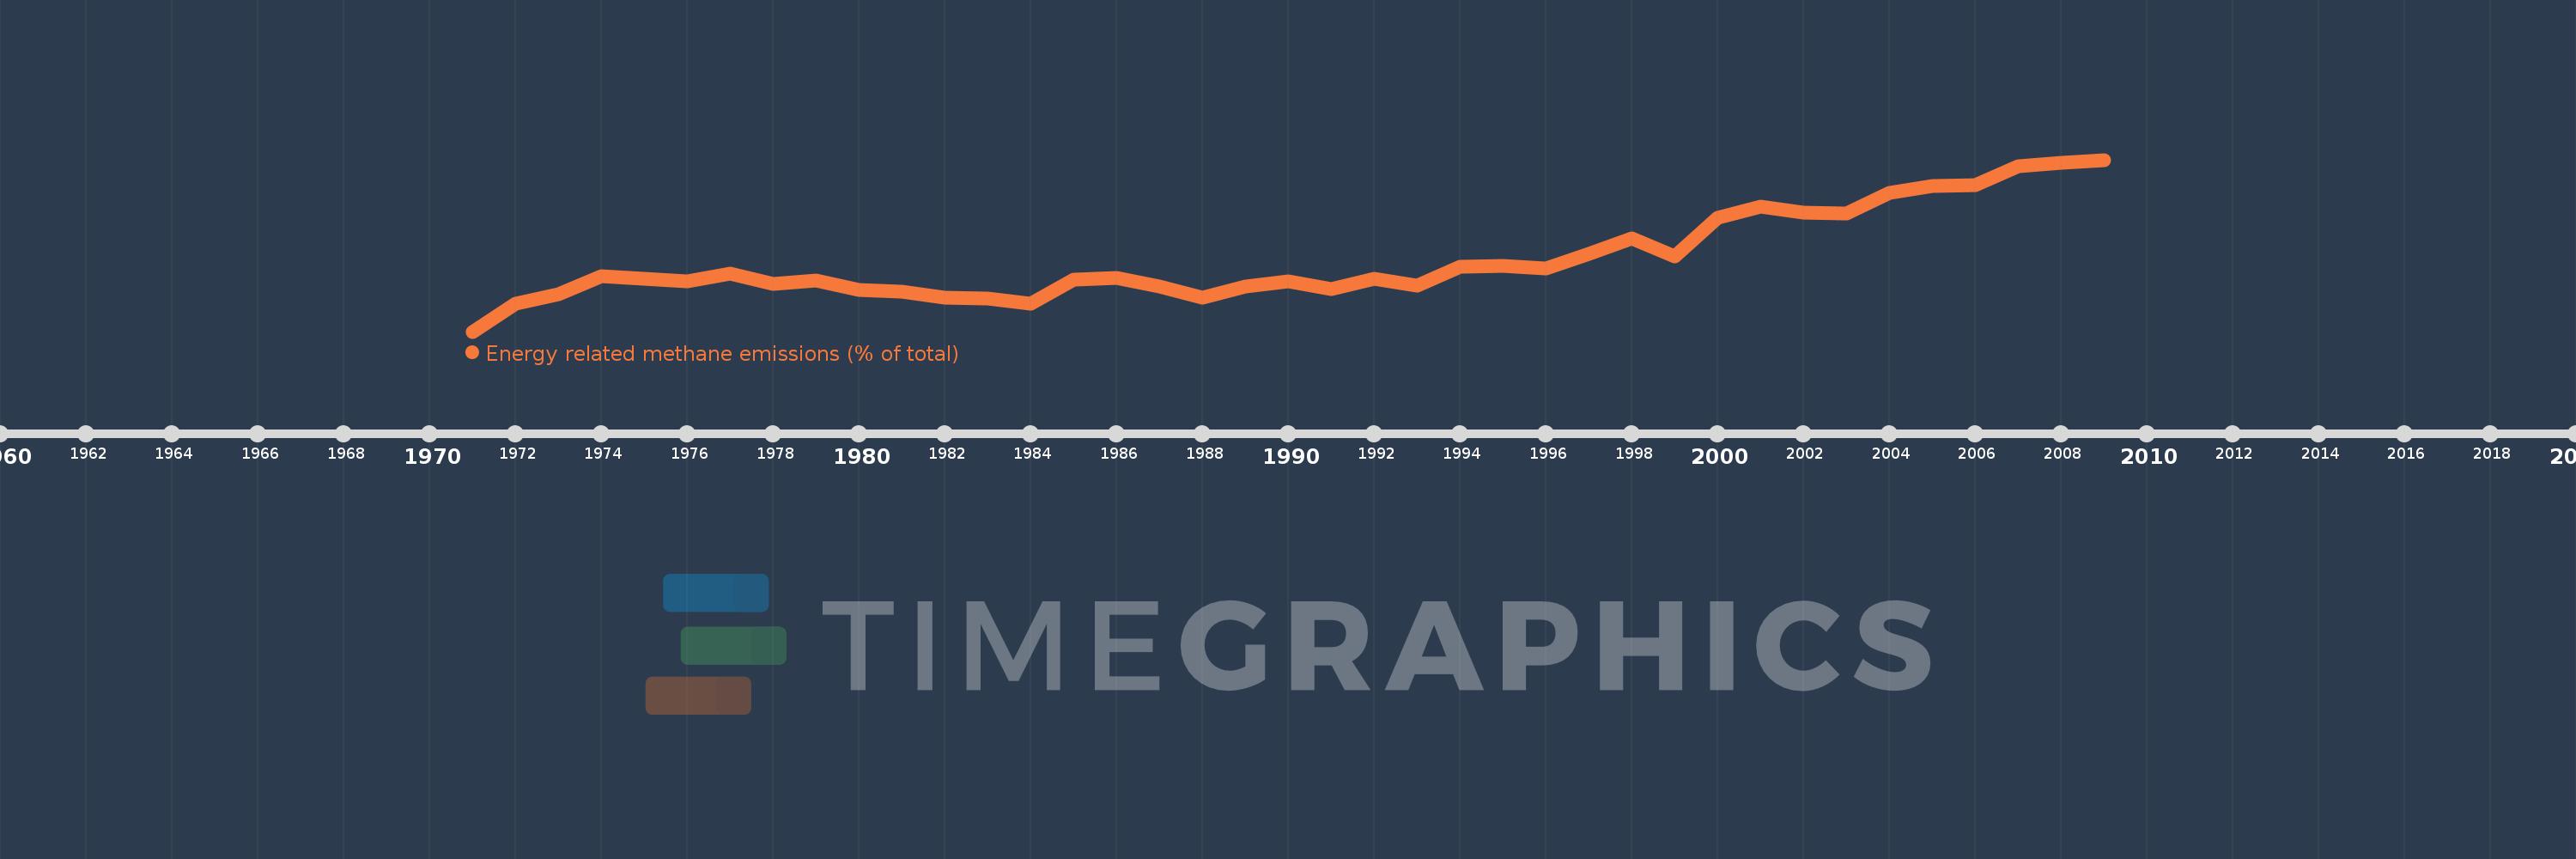
Energy related methane emissions (% of total)
2009,2008,2007,2006,2005,2004,2003,2002,2001,2000,1999,1998,1997,1996,1995,1994,1993,1992,1991,1990,1989,1988,1987,1986,1985,1984,1983,1982,1981,1980,1979,1978,1977,1976,1975,1974,1973,1972,1971
Estas estatísticas em outros países:
AfghanistanAlbaniaAlgeriaAmerican SamoaAngolaAntigua and BarbudaArab WorldArgentinaArmeniaArubaAustraliaAustriaAzerbaijanBahamas, TheBahrainBangladeshBarbadosBelarusBelgiumBelizeBeninBermudaBhutanBoliviaBosnia and HerzegovinaBotswanaBrazilBritish Virgin IslandsBrunei DarussalamBulgariaBurkina FasoBurundiCabo VerdeCambodiaCameroonCanadaCaribbean small statesCayman IslandsCentral African RepublicCentral Europe and the BalticsChadChileChinaColombiaComorosCongo, Dem. Rep.Congo, Rep.Costa RicaCote d'IvoireCroatiaCubaCyprusCzech RepublicDenmarkDjiboutiDominicaDominican RepublicEarly-demographic dividendEast Asia & PacificEast Asia & Pacific (excluding high income)East Asia & Pacific (IDA & IBRD countries)EcuadorEgypt, Arab Rep.El SalvadorEquatorial GuineaEritreaEstoniaEthiopiaEuro areaEurope & Central AsiaEurope & Central Asia (excluding high income)Europe & Central Asia (IDA & IBRD countries)European UnionFaroe IslandsFijiFinlandFragile and conflict affected situationsFranceFrench PolynesiaGabonGambia, TheGeorgiaGermanyGhanaGibraltarGreeceGreenlandGrenadaGuamGuatemalaGuineaGuinea-BissauGuyanaHaitiHeavily indebted poor countries (HIPC)High incomeHondurasHong Kong SAR, ChinaHungaryIBRD onlyIcelandIDA & IBRD totalIDA blendIDA onlyIDA totalIndiaIndonesiaIran, Islamic Rep.IraqIrelandIsraelItalyJamaicaJapanJordanKazakhstanKenyaKiribatiKorea, Dem. People’s Rep.Korea, Rep.KuwaitKyrgyz RepublicLao PDRLate-demographic dividendLatin America & Caribbean Latin America & Caribbean (excluding high income)Latin America & the Caribbean (IDA & IBRD countries)LatviaLeast developed countries: UN classificationLebanonLesothoLiberiaLibyaLithuaniaLow & middle incomeLow incomeLower middle incomeLuxembourgMacao SAR, ChinaMacedonia, FYRMadagascarMalawiMalaysiaMaldivesMaliMaltaMarshall IslandsMauritaniaMauritiusMexicoMicronesia, Fed. Sts.Middle East & North AfricaMiddle East & North Africa (excluding high income)Middle East & North Africa (IDA & IBRD countries)Middle incomeMoldovaMongoliaMoroccoMozambiqueMyanmarNamibiaNauruNepalNetherlandsNew CaledoniaNew ZealandNicaraguaNigerNigeriaNorth AmericaNorthern Mariana IslandsNorwayOECD membersOmanOther small statesPacific island small statesPakistanPalauPanamaPapua New GuineaParaguayPeruPhilippinesPolandPortugalPost-demographic dividendPre-demographic dividendPuerto RicoQatarRomaniaRussian FederationRwandaSamoaSao Tome and PrincipeSaudi ArabiaSenegalSerbiaSeychellesSierra LeoneSingaporeSlovak RepublicSloveniaSmall statesSolomon IslandsSomaliaSouth AfricaSouth AsiaSouth Asia (IDA & IBRD)SpainSri LankaSt. Kitts and NevisSt. LuciaSt. Vincent and the GrenadinesSub-Saharan Africa Sub-Saharan Africa (excluding high income)Sub-Saharan Africa (IDA & IBRD countries)SudanSurinameSwazilandSwedenSwitzerlandSyrian Arab RepublicTajikistanTanzaniaThailandTimor-LesteTogoTongaTrinidad and TobagoTunisiaTurkeyTurkmenistanTurks and Caicos IslandsTuvaluUgandaUkraineUnited Arab EmiratesUnited KingdomUnited StatesUpper middle incomeUruguayUzbekistanVanuatuVenezuela, RBVietnamVirgin Islands (U.S.)WorldYemen, Rep.ZambiaZimbabwe Linha do tempo:
Nesta escala de tempo está apresentado um gráfico de 1971 ano até 2009 ano Small states. Dados de 1970 ano ausente. O número de observações reais por data: 39.
Fonte (nome):
Indicadores de desenvolvimento mundial
Fonte (organização):
World Bank staff estimates from original source: European Commission, Joint Research Centre (JRC)/Netherlands Environmental Assessment Agency (PBL). Emission Database for Global Atmospheric Research (EDGAR): http://edgar.jrc.ec.europa.eu/.
Categorias:
Energy & Mining, Environment
Foi atualizado:
23 abr 2017 ano
Indicadores de alterações dos valores ao longo dos anos
Mínimo:
30.592
1 jan 1971 ano
Máximo:
65.627
1 jan 2009 ano
Na data de observação
Valor
Mudança absoluta
A alteração em relação ao valor anterior
1 jan 1971 ano
30.592
+30.592
0.0%
1 jan 1972 ano
36.289
+5.697
18.62%
1 jan 1973 ano
38.139
+1.85
5.1%
1 jan 1974 ano
41.898
+3.759
9.86%
1 jan 1975 ano
41.433
-0.465
-1.11%
1 jan 1976 ano
40.806
-0.628
-1.51%
1 jan 1977 ano
42.468
+1.663
4.07%
1 jan 1978 ano
40.379
-2.089
-4.92%
1 jan 1979 ano
41.039
+0.66
1.63%
1 jan 1980 ano
39.124
-1.915
-4.67%
1 jan 1981 ano
38.739
-0.385
-0.98%
1 jan 1982 ano
37.572
-1.168
-3.01%
1 jan 1983 ano
37.312
-0.26
-0.69%
1 jan 1984 ano
36.242
-1.069
-2.87%
1 jan 1985 ano
41.114
+4.872
13.44%
1 jan 1986 ano
41.582
+0.468
1.14%
1 jan 1987 ano
39.808
-1.775
-4.27%
1 jan 1988 ano
37.515
-2.292
-5.76%
1 jan 1989 ano
39.851
+2.335
6.23%
1 jan 1990 ano
40.884
+1.033
2.59%
1 jan 1991 ano
39.35
-1.533
-3.75%
1 jan 1992 ano
41.394
+2.043
5.19%
1 jan 1993 ano
39.936
-1.458
-3.52%
1 jan 1994 ano
43.745
+3.809
9.54%
1 jan 1995 ano
44.077
+0.331
0.76%
1 jan 1996 ano
43.466
-0.61
-1.39%
1 jan 1997 ano
46.362
+2.896
6.66%
1 jan 1998 ano
49.647
+3.285
7.09%
1 jan 1999 ano
45.93
-3.717
-7.49%
1 jan 2000 ano
53.797
+7.868
17.13%
1 jan 2001 ano
56.058
+2.261
4.2%
1 jan 2002 ano
54.867
-1.191
-2.12%
1 jan 2003 ano
54.703
-0.164
-0.3%
1 jan 2004 ano
58.912
+4.209
7.69%
1 jan 2005 ano
60.292
+1.38
2.34%
1 jan 2006 ano
60.45
+0.158
0.26%
1 jan 2007 ano
64.307
+3.857
6.38%
1 jan 2008 ano
65.047
+0.74
1.15%
1 jan 2009 ano
65.627
+0.58
0.89%
Classificação de países por estatísticas atuais por anos


Comentários: