29
/pt/
pt
AIzaSyAYiBZKx7MnpbEhh9jyipgxe19OcubqV5w
April 1, 2024
139192
Germany
DEU
true
2
1
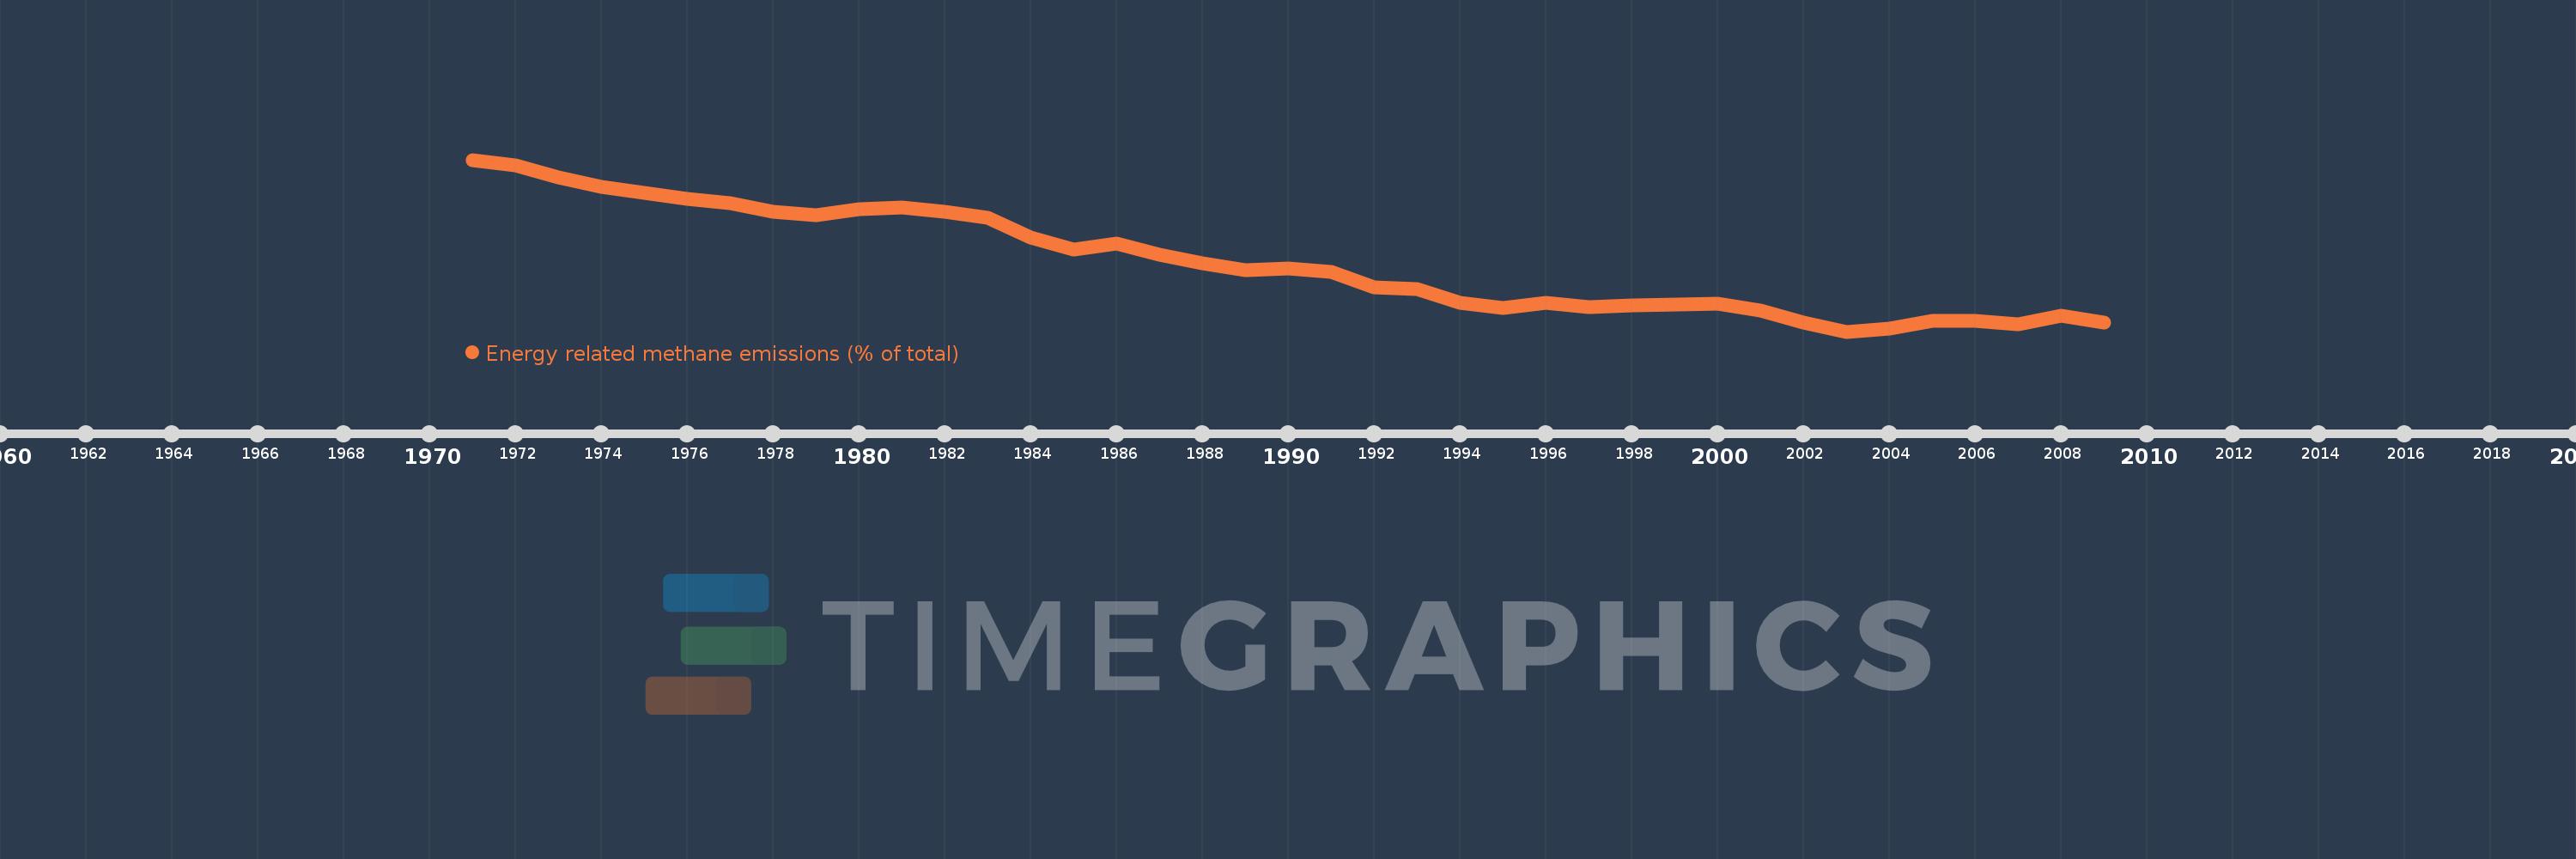
Energy related methane emissions (% of total)
2009,2008,2007,2006,2005,2004,2003,2002,2001,2000,1999,1998,1997,1996,1995,1994,1993,1992,1991,1990,1989,1988,1987,1986,1985,1984,1983,1982,1981,1980,1979,1978,1977,1976,1975,1974,1973,1972,1971
Estas estatísticas em outros países:
AfghanistanAlbaniaAlgeriaAmerican SamoaAngolaAntigua and BarbudaArab WorldArgentinaArmeniaArubaAustraliaAustriaAzerbaijanBahamas, TheBahrainBangladeshBarbadosBelarusBelgiumBelizeBeninBermudaBhutanBoliviaBosnia and HerzegovinaBotswanaBrazilBritish Virgin IslandsBrunei DarussalamBulgariaBurkina FasoBurundiCabo VerdeCambodiaCameroonCanadaCaribbean small statesCayman IslandsCentral African RepublicCentral Europe and the BalticsChadChileChinaColombiaComorosCongo, Dem. Rep.Congo, Rep.Costa RicaCote d'IvoireCroatiaCubaCyprusCzech RepublicDenmarkDjiboutiDominicaDominican RepublicEarly-demographic dividendEast Asia & PacificEast Asia & Pacific (excluding high income)East Asia & Pacific (IDA & IBRD countries)EcuadorEgypt, Arab Rep.El SalvadorEquatorial GuineaEritreaEstoniaEthiopiaEuro areaEurope & Central AsiaEurope & Central Asia (excluding high income)Europe & Central Asia (IDA & IBRD countries)European UnionFaroe IslandsFijiFinlandFragile and conflict affected situationsFranceFrench PolynesiaGabonGambia, TheGeorgiaGermanyGhanaGibraltarGreeceGreenlandGrenadaGuamGuatemalaGuineaGuinea-BissauGuyanaHaitiHeavily indebted poor countries (HIPC)High incomeHondurasHong Kong SAR, ChinaHungaryIBRD onlyIcelandIDA & IBRD totalIDA blendIDA onlyIDA totalIndiaIndonesiaIran, Islamic Rep.IraqIrelandIsraelItalyJamaicaJapanJordanKazakhstanKenyaKiribatiKorea, Dem. People’s Rep.Korea, Rep.KuwaitKyrgyz RepublicLao PDRLate-demographic dividendLatin America & Caribbean Latin America & Caribbean (excluding high income)Latin America & the Caribbean (IDA & IBRD countries)LatviaLeast developed countries: UN classificationLebanonLesothoLiberiaLibyaLithuaniaLow & middle incomeLow incomeLower middle incomeLuxembourgMacao SAR, ChinaMacedonia, FYRMadagascarMalawiMalaysiaMaldivesMaliMaltaMarshall IslandsMauritaniaMauritiusMexicoMicronesia, Fed. Sts.Middle East & North AfricaMiddle East & North Africa (excluding high income)Middle East & North Africa (IDA & IBRD countries)Middle incomeMoldovaMongoliaMoroccoMozambiqueMyanmarNamibiaNauruNepalNetherlandsNew CaledoniaNew ZealandNicaraguaNigerNigeriaNorth AmericaNorthern Mariana IslandsNorwayOECD membersOmanOther small statesPacific island small statesPakistanPalauPanamaPapua New GuineaParaguayPeruPhilippinesPolandPortugalPost-demographic dividendPre-demographic dividendPuerto RicoQatarRomaniaRussian FederationRwandaSamoaSao Tome and PrincipeSaudi ArabiaSenegalSerbiaSeychellesSierra LeoneSingaporeSlovak RepublicSloveniaSmall statesSolomon IslandsSomaliaSouth AfricaSouth AsiaSouth Asia (IDA & IBRD)SpainSri LankaSt. Kitts and NevisSt. LuciaSt. Vincent and the GrenadinesSub-Saharan Africa Sub-Saharan Africa (excluding high income)Sub-Saharan Africa (IDA & IBRD countries)SudanSurinameSwazilandSwedenSwitzerlandSyrian Arab RepublicTajikistanTanzaniaThailandTimor-LesteTogoTongaTrinidad and TobagoTunisiaTurkeyTurkmenistanTurks and Caicos IslandsTuvaluUgandaUkraineUnited Arab EmiratesUnited KingdomUnited StatesUpper middle incomeUruguayUzbekistanVanuatuVenezuela, RBVietnamVirgin Islands (U.S.)WorldYemen, Rep.ZambiaZimbabwe Linha do tempo:
Nesta escala de tempo está apresentado um gráfico de 1971 ano até 2009 ano Germany. Dados de 1970 ano ausente. O número de observações reais por data: 39.
Fonte (nome):
Indicadores de desenvolvimento mundial
Fonte (organização):
World Bank staff estimates from original source: European Commission, Joint Research Centre (JRC)/Netherlands Environmental Assessment Agency (PBL). Emission Database for Global Atmospheric Research (EDGAR): http://edgar.jrc.ec.europa.eu/.
Categorias:
Energy & Mining, Environment
Foi atualizado:
23 abr 2017 ano
Indicadores de alterações dos valores ao longo dos anos
Mínimo:
25.674
1 jan 2003 ano
Máximo:
43.581
1 jan 1971 ano
Na data de observação
Valor
Mudança absoluta
A alteração em relação ao valor anterior
1 jan 1971 ano
43.581
+43.581
0.0%
1 jan 1972 ano
43.032
-0.548
-1.26%
1 jan 1973 ano
41.757
-1.275
-2.96%
1 jan 1974 ano
40.755
-1.002
-2.4%
1 jan 1975 ano
40.137
-0.618
-1.52%
1 jan 1976 ano
39.547
-0.591
-1.47%
1 jan 1977 ano
39.036
-0.511
-1.29%
1 jan 1978 ano
38.139
-0.897
-2.3%
1 jan 1979 ano
37.807
-0.332
-0.87%
1 jan 1980 ano
38.388
+0.582
1.54%
1 jan 1981 ano
38.573
+0.185
0.48%
1 jan 1982 ano
38.201
-0.372
-0.96%
1 jan 1983 ano
37.566
-0.635
-1.66%
1 jan 1984 ano
35.461
-2.104
-5.6%
1 jan 1985 ano
34.189
-1.272
-3.59%
1 jan 1986 ano
34.85
+0.66
1.93%
1 jan 1987 ano
33.698
-1.151
-3.3%
1 jan 1988 ano
32.759
-0.939
-2.79%
1 jan 1989 ano
32.12
-0.638
-1.95%
1 jan 1990 ano
32.234
+0.114
0.35%
1 jan 1991 ano
31.877
-0.357
-1.11%
1 jan 1992 ano
30.272
-1.605
-5.04%
1 jan 1993 ano
30.111
-0.161
-0.53%
1 jan 1994 ano
28.706
-1.405
-4.67%
1 jan 1995 ano
28.179
-0.527
-1.83%
1 jan 1996 ano
28.642
+0.463
1.64%
1 jan 1997 ano
28.229
-0.413
-1.44%
1 jan 1998 ano
28.434
+0.205
0.73%
1 jan 1999 ano
28.514
+0.081
0.28%
1 jan 2000 ano
28.59
+0.075
0.26%
1 jan 2001 ano
27.908
-0.682
-2.38%
1 jan 2002 ano
26.572
-1.336
-4.79%
1 jan 2003 ano
25.674
-0.898
-3.38%
1 jan 2004 ano
26.031
+0.357
1.39%
1 jan 2005 ano
26.786
+0.755
2.9%
1 jan 2006 ano
26.791
+0.005
0.02%
1 jan 2007 ano
26.45
-0.341
-1.27%
1 jan 2008 ano
27.342
+0.891
3.37%
1 jan 2009 ano
26.614
-0.727
-2.66%
Classificação de países por estatísticas atuais por anos


Comentários: