29
/pt/
pt
AIzaSyAYiBZKx7MnpbEhh9jyipgxe19OcubqV5w
April 1, 2024
89879
Botswana
BWA
true
2
1
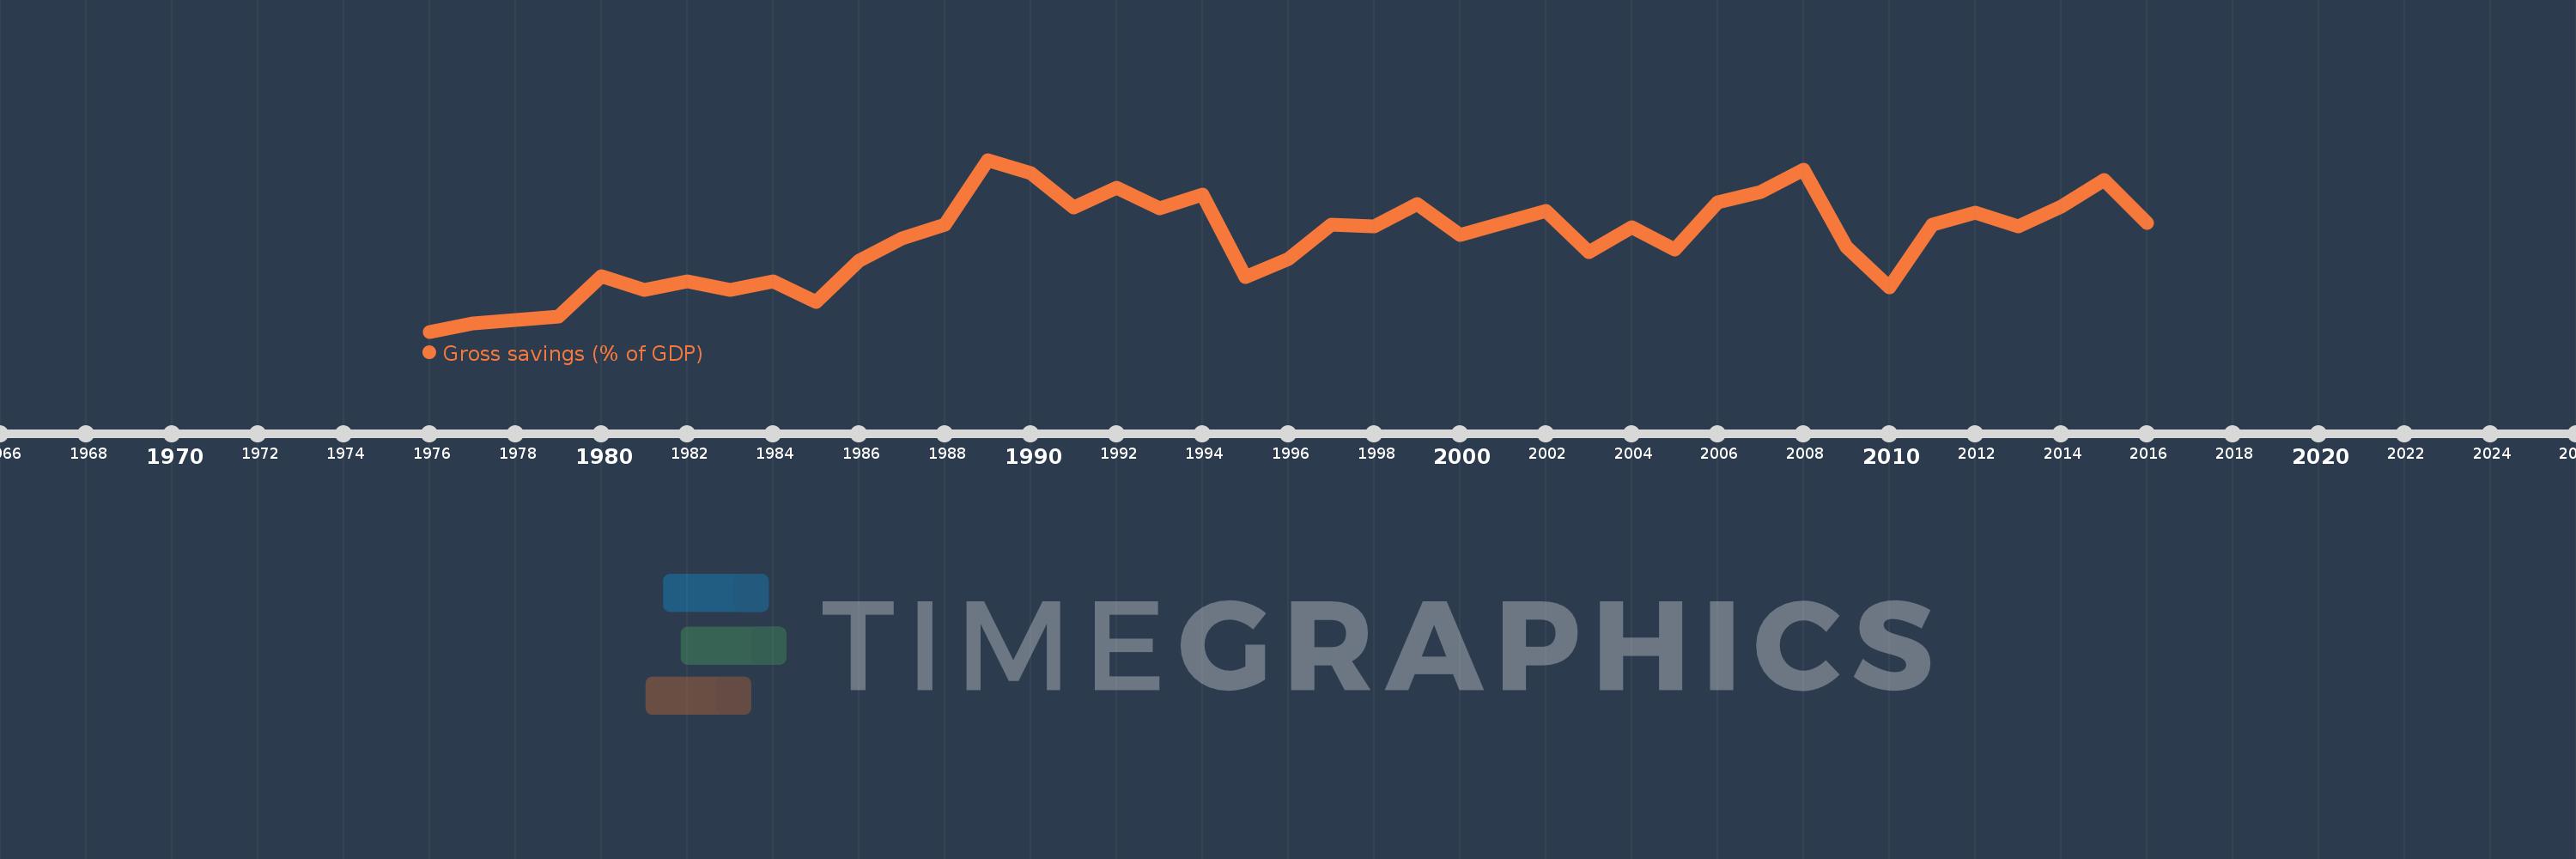
Gross savings (% of GDP)
2016,2015,2014,2013,2012,2011,2010,2009,2008,2007,2006,2005,2004,2003,2002,2001,2000,1999,1998,1997,1996,1995,1994,1993,1992,1991,1990,1989,1988,1987,1986,1985,1984,1983,1982,1981,1980,1979,1978,1977,1976
Estas estatísticas em outros países:
AfghanistanAlbaniaAlgeriaAngolaAntigua and BarbudaArab WorldArgentinaArmeniaAustraliaAustriaAzerbaijanBahamas, TheBahrainBangladeshBarbadosBelarusBelgiumBelizeBeninBermudaBhutanBoliviaBosnia and HerzegovinaBotswanaBrazilBrunei DarussalamBulgariaBurkina FasoBurundiCabo VerdeCambodiaCameroonCanadaCaribbean small statesCentral African RepublicCentral Europe and the BalticsChadChileChinaColombiaComorosCongo, Dem. Rep.Congo, Rep.Costa RicaCote d'IvoireCroatiaCyprusCzech RepublicDenmarkDjiboutiDominicaDominican RepublicEarly-demographic dividendEast Asia & PacificEast Asia & Pacific (excluding high income)East Asia & Pacific (IDA & IBRD countries)EcuadorEgypt, Arab Rep.El SalvadorEquatorial GuineaEritreaEstoniaEthiopiaEuro areaEurope & Central AsiaEurope & Central Asia (excluding high income)Europe & Central Asia (IDA & IBRD countries)European UnionFaroe IslandsFijiFinlandFragile and conflict affected situationsFranceGabonGambia, TheGeorgiaGermanyGhanaGreeceGrenadaGuatemalaGuineaGuinea-BissauGuyanaHaitiHeavily indebted poor countries (HIPC)High incomeHondurasHong Kong SAR, ChinaHungaryIBRD onlyIcelandIDA & IBRD totalIDA blendIDA onlyIDA totalIndiaIndonesiaIran, Islamic Rep.IraqIrelandIsraelItalyJamaicaJapanJordanKazakhstanKenyaKiribatiKorea, Rep.KosovoKuwaitKyrgyz RepublicLao PDRLate-demographic dividendLatin America & Caribbean Latin America & Caribbean (excluding high income)Latin America & the Caribbean (IDA & IBRD countries)LatviaLeast developed countries: UN classificationLebanonLesothoLiberiaLibyaLithuaniaLow & middle incomeLow incomeLower middle incomeLuxembourgMacao SAR, ChinaMacedonia, FYRMadagascarMalawiMalaysiaMaldivesMaliMaltaMauritaniaMauritiusMexicoMiddle East & North AfricaMiddle East & North Africa (excluding high income)Middle East & North Africa (IDA & IBRD countries)Middle incomeMoldovaMongoliaMontenegroMoroccoMozambiqueNamibiaNepalNetherlandsNew ZealandNicaraguaNigerNigeriaNorth AmericaNorwayOECD membersOmanOther small statesPacific island small statesPakistanPanamaPapua New GuineaParaguayPeruPhilippinesPolandPortugalPost-demographic dividendPre-demographic dividendQatarRomaniaRussian FederationRwandaSaudi ArabiaSenegalSerbiaSeychellesSierra LeoneSingaporeSlovak RepublicSloveniaSmall statesSolomon IslandsSouth AfricaSouth AsiaSouth Asia (IDA & IBRD)South SudanSpainSri LankaSt. Kitts and NevisSt. LuciaSt. Vincent and the GrenadinesSub-Saharan Africa Sub-Saharan Africa (excluding high income)Sub-Saharan Africa (IDA & IBRD countries)SudanSurinameSwazilandSwedenSwitzerlandSyrian Arab RepublicTajikistanTanzaniaThailandTimor-LesteTogoTongaTrinidad and TobagoTunisiaTurkeyUgandaUkraineUnited KingdomUnited StatesUpper middle incomeUruguayVanuatuVenezuela, RBVietnamWest Bank and GazaWorldYemen, Rep.ZambiaZimbabwe Linha do tempo:
Nesta escala de tempo está apresentado um gráfico de 1976 ano até 2016 ano Botswana. Dados de 1975 ano ausente. O número de observações reais por data: 41.
Fonte (nome):
Indicadores de desenvolvimento mundial
Fonte (organização):
World Bank national accounts data, and OECD National Accounts data files.
Categorias:
Economy & Growth
Foi atualizado:
23 abr 2017 ano
Indicadores de alterações dos valores ao longo dos anos
Mínimo:
20.255
1 jan 1976 ano
Máximo:
49.819
1 jan 1989 ano
Na data de observação
Valor
Mudança absoluta
A alteração em relação ao valor anterior
1 jan 1976 ano
20.255
+20.255
0.0%
1 jan 1977 ano
21.669
+1.414
6.98%
1 jan 1978 ano
22.235
+0.566
2.61%
1 jan 1979 ano
22.784
+0.548
2.47%
1 jan 1980 ano
29.804
+7.02
30.81%
1 jan 1981 ano
27.433
-2.371
-7.95%
1 jan 1982 ano
28.848
+1.415
5.16%
1 jan 1983 ano
27.396
-1.452
-5.03%
1 jan 1984 ano
28.907
+1.511
5.52%
1 jan 1985 ano
25.353
-3.554
-12.29%
1 jan 1986 ano
32.429
+7.076
27.91%
1 jan 1987 ano
36.247
+3.818
11.77%
1 jan 1988 ano
38.703
+2.456
6.78%
1 jan 1989 ano
49.819
+11.116
28.72%
1 jan 1990 ano
47.479
-2.34
-4.7%
1 jan 1991 ano
41.648
-5.831
-12.28%
1 jan 1992 ano
44.996
+3.349
8.04%
1 jan 1993 ano
41.398
-3.598
-8.0%
1 jan 1994 ano
43.841
+2.443
5.9%
1 jan 1995 ano
29.629
-14.212
-32.42%
1 jan 1996 ano
32.702
+3.073
10.37%
1 jan 1997 ano
38.614
+5.912
18.08%
1 jan 1998 ano
38.335
-0.278
-0.72%
1 jan 1999 ano
42.183
+3.848
10.04%
1 jan 2000 ano
36.901
-5.283
-12.52%
1 jan 2001 ano
38.956
+2.056
5.57%
1 jan 2002 ano
41.013
+2.056
5.28%
1 jan 2003 ano
33.862
-7.151
-17.44%
1 jan 2004 ano
38.226
+4.364
12.89%
1 jan 2005 ano
34.3
-3.927
-10.27%
1 jan 2006 ano
42.436
+8.137
23.72%
1 jan 2007 ano
44.255
+1.819
4.29%
1 jan 2008 ano
48.143
+3.888
8.79%
1 jan 2009 ano
34.854
-13.289
-27.6%
1 jan 2010 ano
27.832
-7.022
-20.15%
1 jan 2011 ano
38.628
+10.796
38.79%
1 jan 2012 ano
40.793
+2.166
5.61%
1 jan 2013 ano
38.361
-2.432
-5.96%
1 jan 2014 ano
41.795
+3.434
8.95%
1 jan 2015 ano
46.348
+4.553
10.89%
1 jan 2016 ano
38.889
-7.459
-16.09%
Classificação de países por estatísticas atuais por anos


Comentários: