29
/pt/
pt
AIzaSyAYiBZKx7MnpbEhh9jyipgxe19OcubqV5w
April 1, 2024
194302
Mauritius
MUS
true
2
1
Gross savings (% of GDP)
2016,2015,2014,2013,2012,2011,2010,2009,2008,2007,2006,2005,2004,2003,2002,2001,2000,1999,1998,1997,1996,1995,1994,1993,1992,1991,1990,1989,1988,1987,1986,1985,1984,1983,1982,1981,1980,1979,1978,1977
Estas estatísticas em outros países:
AfghanistanAlbaniaAlgeriaAngolaAntigua and BarbudaArab WorldArgentinaArmeniaAustraliaAustriaAzerbaijanBahamas, TheBahrainBangladeshBarbadosBelarusBelgiumBelizeBeninBermudaBhutanBoliviaBosnia and HerzegovinaBotswanaBrazilBrunei DarussalamBulgariaBurkina FasoBurundiCabo VerdeCambodiaCameroonCanadaCaribbean small statesCentral African RepublicCentral Europe and the BalticsChadChileChinaColombiaComorosCongo, Dem. Rep.Congo, Rep.Costa RicaCote d'IvoireCroatiaCyprusCzech RepublicDenmarkDjiboutiDominicaDominican RepublicEarly-demographic dividendEast Asia & PacificEast Asia & Pacific (excluding high income)East Asia & Pacific (IDA & IBRD countries)EcuadorEgypt, Arab Rep.El SalvadorEquatorial GuineaEritreaEstoniaEthiopiaEuro areaEurope & Central AsiaEurope & Central Asia (excluding high income)Europe & Central Asia (IDA & IBRD countries)European UnionFaroe IslandsFijiFinlandFragile and conflict affected situationsFranceGabonGambia, TheGeorgiaGermanyGhanaGreeceGrenadaGuatemalaGuineaGuinea-BissauGuyanaHaitiHeavily indebted poor countries (HIPC)High incomeHondurasHong Kong SAR, ChinaHungaryIBRD onlyIcelandIDA & IBRD totalIDA blendIDA onlyIDA totalIndiaIndonesiaIran, Islamic Rep.IraqIrelandIsraelItalyJamaicaJapanJordanKazakhstanKenyaKiribatiKorea, Rep.KosovoKuwaitKyrgyz RepublicLao PDRLate-demographic dividendLatin America & Caribbean Latin America & Caribbean (excluding high income)Latin America & the Caribbean (IDA & IBRD countries)LatviaLeast developed countries: UN classificationLebanonLesothoLiberiaLibyaLithuaniaLow & middle incomeLow incomeLower middle incomeLuxembourgMacao SAR, ChinaMacedonia, FYRMadagascarMalawiMalaysiaMaldivesMaliMaltaMauritaniaMauritiusMexicoMiddle East & North AfricaMiddle East & North Africa (excluding high income)Middle East & North Africa (IDA & IBRD countries)Middle incomeMoldovaMongoliaMontenegroMoroccoMozambiqueNamibiaNepalNetherlandsNew ZealandNicaraguaNigerNigeriaNorth AmericaNorwayOECD membersOmanOther small statesPacific island small statesPakistanPanamaPapua New GuineaParaguayPeruPhilippinesPolandPortugalPost-demographic dividendPre-demographic dividendQatarRomaniaRussian FederationRwandaSaudi ArabiaSenegalSerbiaSeychellesSierra LeoneSingaporeSlovak RepublicSloveniaSmall statesSolomon IslandsSouth AfricaSouth AsiaSouth Asia (IDA & IBRD)South SudanSpainSri LankaSt. Kitts and NevisSt. LuciaSt. Vincent and the GrenadinesSub-Saharan Africa Sub-Saharan Africa (excluding high income)Sub-Saharan Africa (IDA & IBRD countries)SudanSurinameSwazilandSwedenSwitzerlandSyrian Arab RepublicTajikistanTanzaniaThailandTimor-LesteTogoTongaTrinidad and TobagoTunisiaTurkeyUgandaUkraineUnited KingdomUnited StatesUpper middle incomeUruguayVanuatuVenezuela, RBVietnamWest Bank and GazaWorldYemen, Rep.ZambiaZimbabwe Linha do tempo:
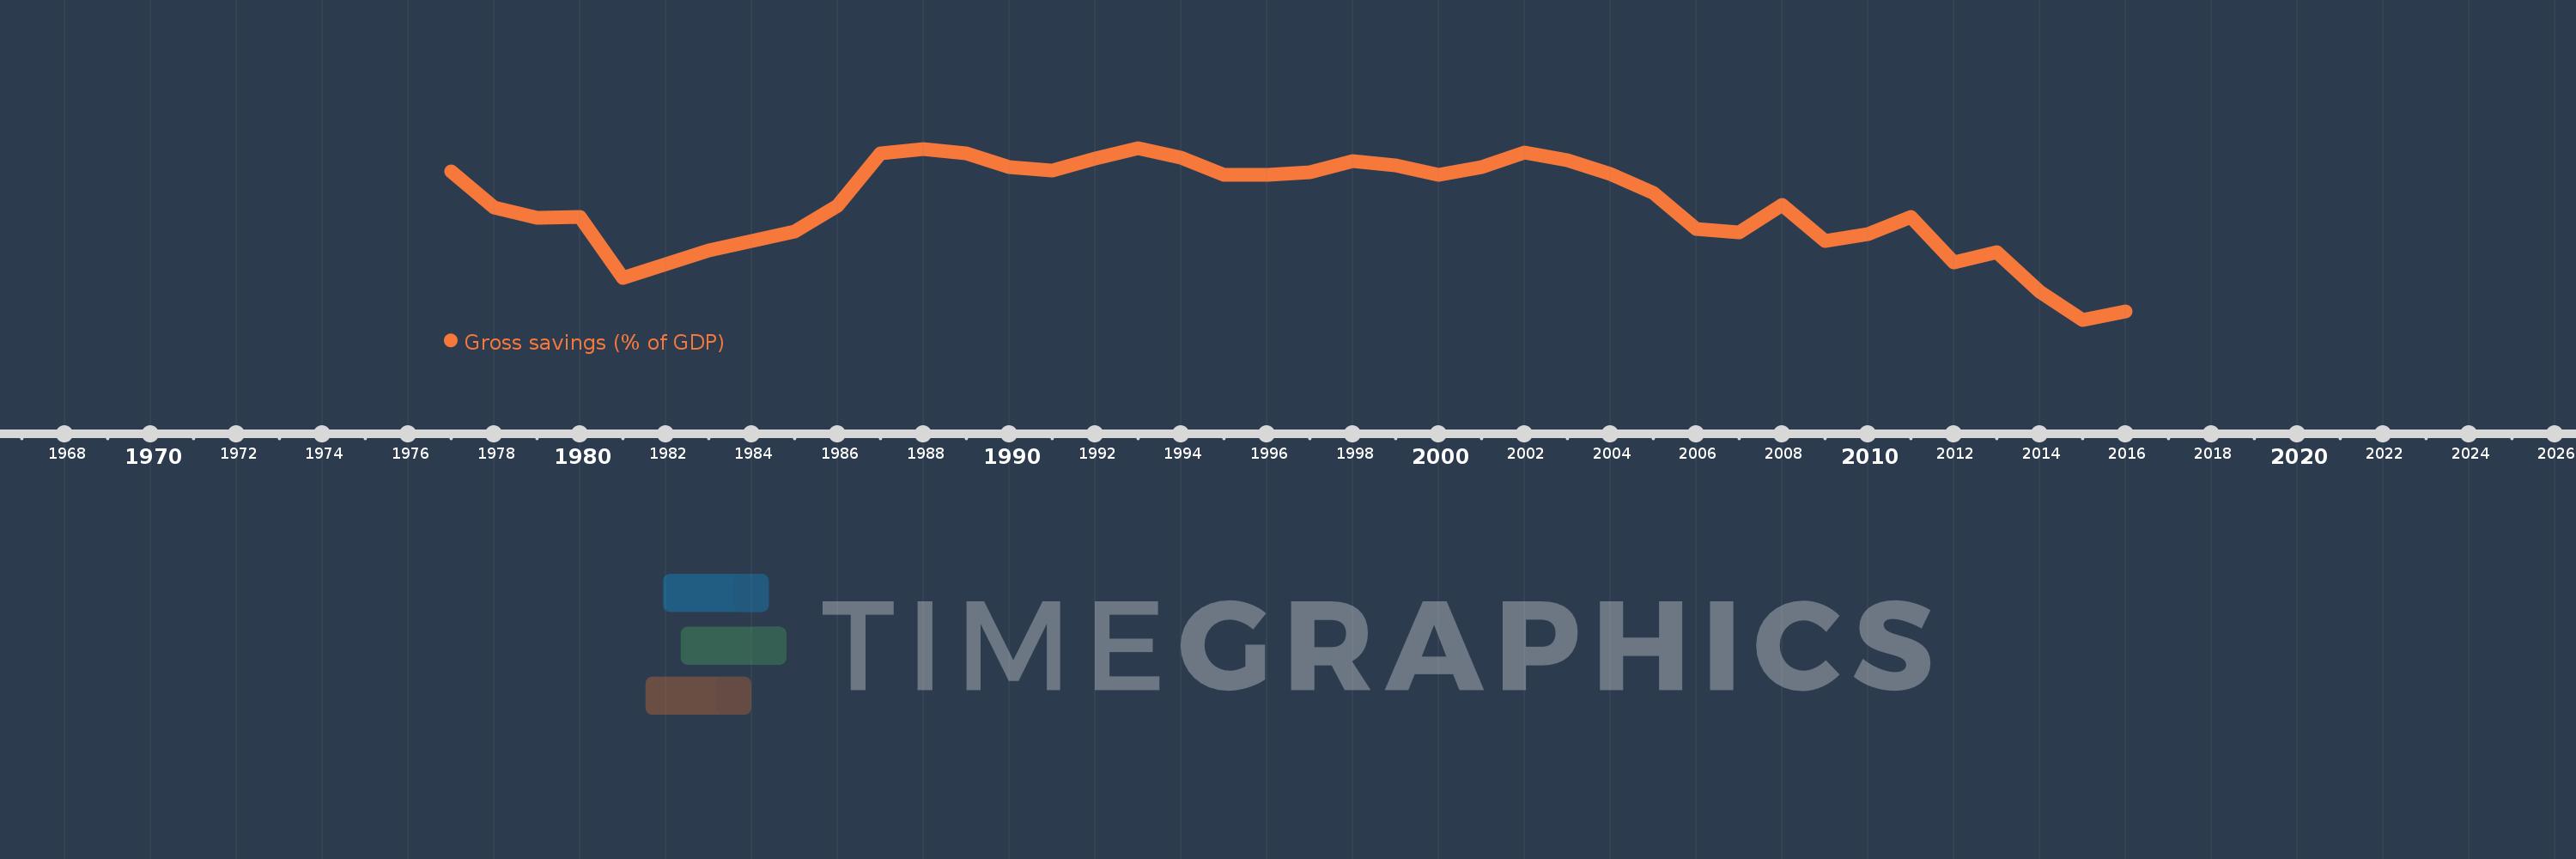
Nesta escala de tempo está apresentado um gráfico de 1977 ano até 2016 ano Mauritius. Dados de 1976 ano ausente. O número de observações reais por data: 40.
Fonte (nome):
Indicadores de desenvolvimento mundial
Fonte (organização):
World Bank national accounts data, and OECD National Accounts data files.
Categorias:
Economy & Growth
Foi atualizado:
23 abr 2017 ano
Indicadores de alterações dos valores ao longo dos anos
Mínimo:
4.328
1 jan 2015 ano
Máximo:
29.063
1 jan 1993 ano
Na data de observação
Valor
Mudança absoluta
A alteração em relação ao valor anterior
1 jan 1977 ano
25.658
+25.658
0.0%
1 jan 1978 ano
20.531
-5.126
-19.98%
1 jan 1979 ano
19.063
-1.468
-7.15%
1 jan 1980 ano
19.108
+0.045
0.23%
1 jan 1981 ano
10.362
-8.746
-45.77%
1 jan 1982 ano
12.3
+1.938
18.7%
1 jan 1983 ano
14.294
+1.994
16.21%
1 jan 1984 ano
15.644
+1.35
9.44%
1 jan 1985 ano
17.059
+1.415
9.05%
1 jan 1986 ano
20.698
+3.638
21.33%
1 jan 1987 ano
28.247
+7.549
36.47%
1 jan 1988 ano
28.931
+0.684
2.42%
1 jan 1989 ano
28.267
-0.663
-2.29%
1 jan 1990 ano
26.265
-2.003
-7.09%
1 jan 1991 ano
25.822
-0.443
-1.69%
1 jan 1992 ano
27.58
+1.758
6.81%
1 jan 1993 ano
29.063
+1.483
5.38%
1 jan 1994 ano
27.721
-1.341
-4.62%
1 jan 1995 ano
25.249
-2.472
-8.92%
1 jan 1996 ano
25.193
-0.056
-0.22%
1 jan 1997 ano
25.617
+0.424
1.68%
1 jan 1998 ano
27.127
+1.51
5.89%
1 jan 1999 ano
26.587
-0.54
-1.99%
1 jan 2000 ano
25.158
-1.429
-5.37%
1 jan 2001 ano
26.32
+1.162
4.62%
1 jan 2002 ano
28.408
+2.088
7.93%
1 jan 2003 ano
27.325
-1.083
-3.81%
1 jan 2004 ano
25.292
-2.033
-7.44%
1 jan 2005 ano
22.6
-2.693
-10.65%
1 jan 2006 ano
17.368
-5.231
-23.15%
1 jan 2007 ano
16.862
-0.506
-2.92%
1 jan 2008 ano
20.806
+3.944
23.39%
1 jan 2009 ano
15.614
-5.192
-24.95%
1 jan 2010 ano
16.707
+1.093
7.0%
1 jan 2011 ano
19.151
+2.444
14.63%
1 jan 2012 ano
12.613
-6.537
-34.14%
1 jan 2013 ano
14.021
+1.408
11.16%
1 jan 2014 ano
8.334
-5.687
-40.56%
1 jan 2015 ano
4.328
-4.006
-48.07%
1 jan 2016 ano
5.574
+1.246
28.79%
Classificação de países por estatísticas atuais por anos


Comentários: