29
/pt/
pt
AIzaSyAYiBZKx7MnpbEhh9jyipgxe19OcubqV5w
April 1, 2024
218414
Panama
PAN
true
2
1
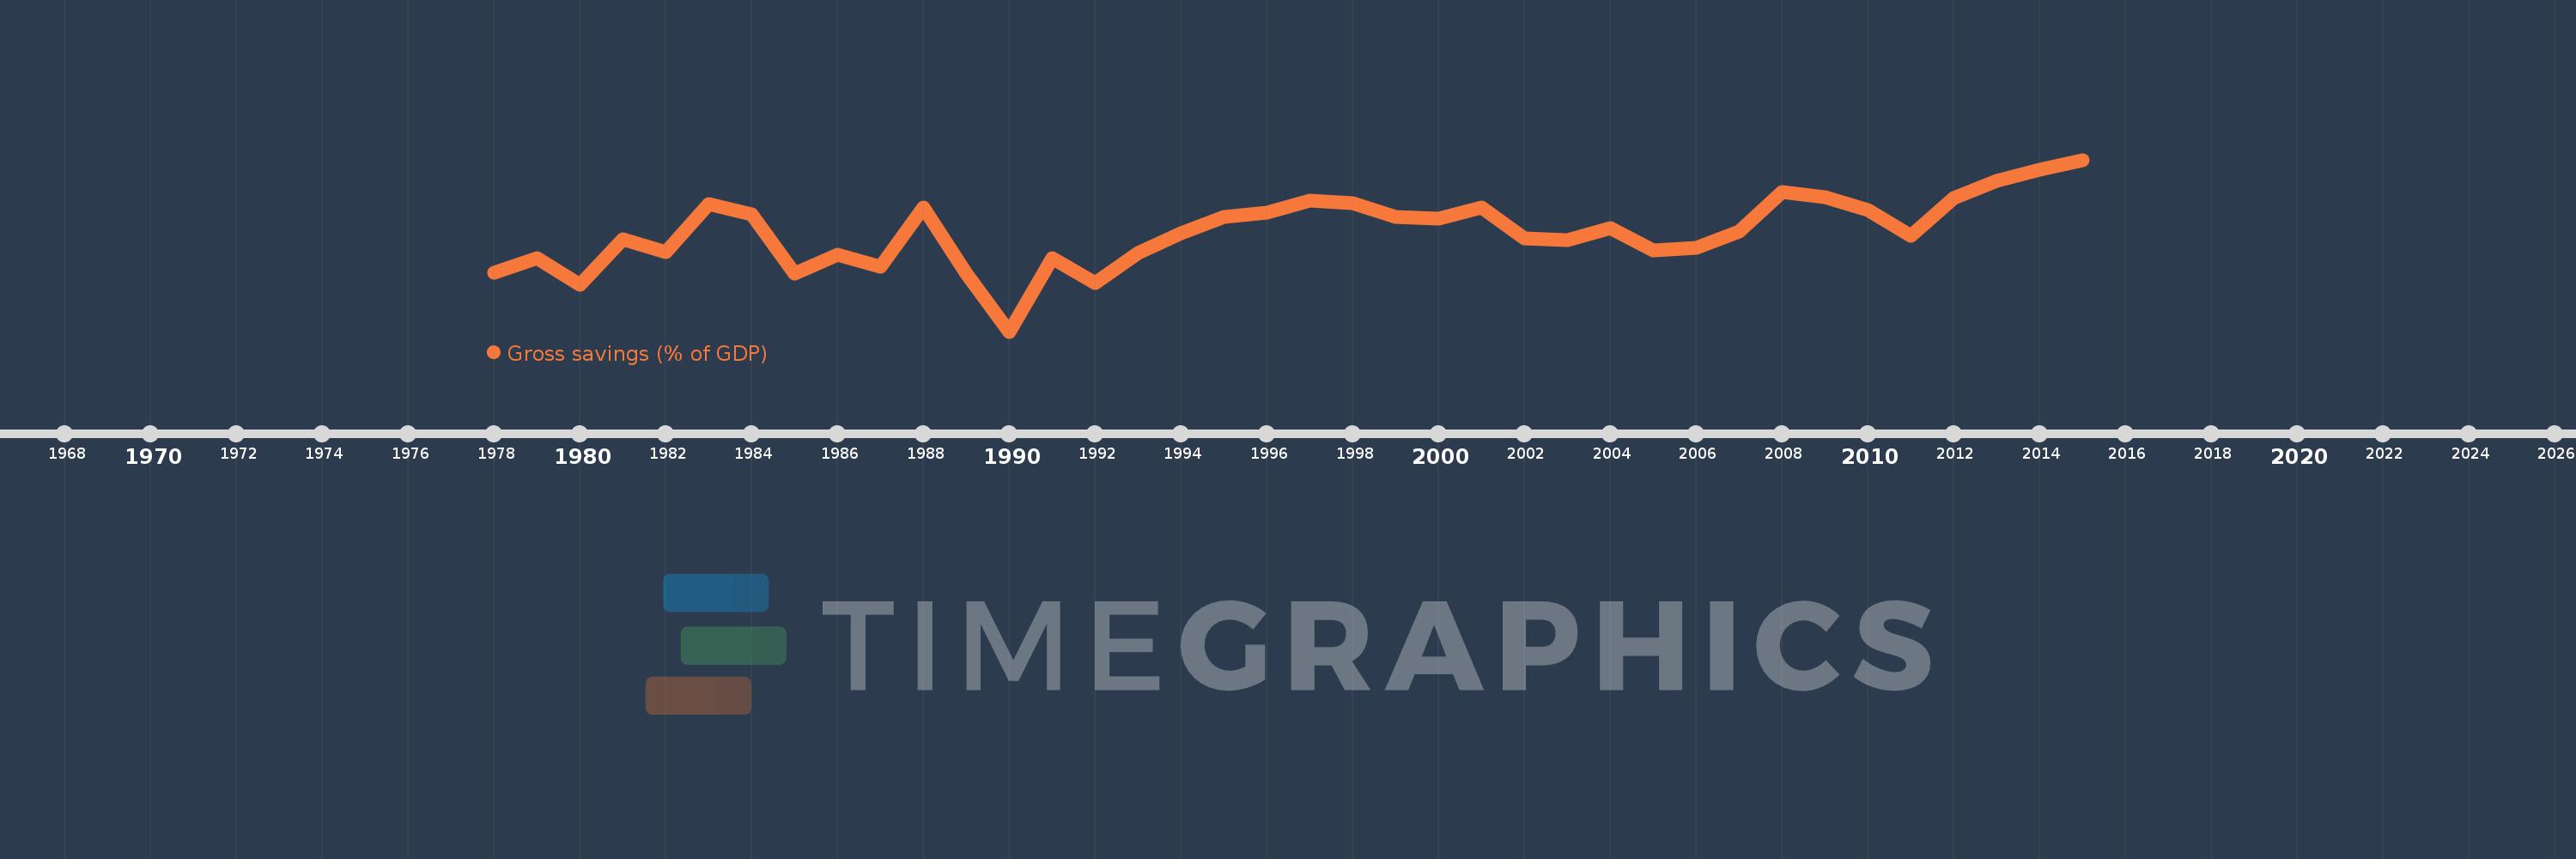
Gross savings (% of GDP)
2015,2014,2013,2012,2011,2010,2009,2008,2007,2006,2005,2004,2003,2002,2001,2000,1999,1998,1997,1996,1995,1994,1993,1992,1991,1990,1989,1988,1987,1986,1985,1984,1983,1982,1981,1980,1979,1978
Estas estatísticas em outros países:
AfghanistanAlbaniaAlgeriaAngolaAntigua and BarbudaArab WorldArgentinaArmeniaAustraliaAustriaAzerbaijanBahamas, TheBahrainBangladeshBarbadosBelarusBelgiumBelizeBeninBermudaBhutanBoliviaBosnia and HerzegovinaBotswanaBrazilBrunei DarussalamBulgariaBurkina FasoBurundiCabo VerdeCambodiaCameroonCanadaCaribbean small statesCentral African RepublicCentral Europe and the BalticsChadChileChinaColombiaComorosCongo, Dem. Rep.Congo, Rep.Costa RicaCote d'IvoireCroatiaCyprusCzech RepublicDenmarkDjiboutiDominicaDominican RepublicEarly-demographic dividendEast Asia & PacificEast Asia & Pacific (excluding high income)East Asia & Pacific (IDA & IBRD countries)EcuadorEgypt, Arab Rep.El SalvadorEquatorial GuineaEritreaEstoniaEthiopiaEuro areaEurope & Central AsiaEurope & Central Asia (excluding high income)Europe & Central Asia (IDA & IBRD countries)European UnionFaroe IslandsFijiFinlandFragile and conflict affected situationsFranceGabonGambia, TheGeorgiaGermanyGhanaGreeceGrenadaGuatemalaGuineaGuinea-BissauGuyanaHaitiHeavily indebted poor countries (HIPC)High incomeHondurasHong Kong SAR, ChinaHungaryIBRD onlyIcelandIDA & IBRD totalIDA blendIDA onlyIDA totalIndiaIndonesiaIran, Islamic Rep.IraqIrelandIsraelItalyJamaicaJapanJordanKazakhstanKenyaKiribatiKorea, Rep.KosovoKuwaitKyrgyz RepublicLao PDRLate-demographic dividendLatin America & Caribbean Latin America & Caribbean (excluding high income)Latin America & the Caribbean (IDA & IBRD countries)LatviaLeast developed countries: UN classificationLebanonLesothoLiberiaLibyaLithuaniaLow & middle incomeLow incomeLower middle incomeLuxembourgMacao SAR, ChinaMacedonia, FYRMadagascarMalawiMalaysiaMaldivesMaliMaltaMauritaniaMauritiusMexicoMiddle East & North AfricaMiddle East & North Africa (excluding high income)Middle East & North Africa (IDA & IBRD countries)Middle incomeMoldovaMongoliaMontenegroMoroccoMozambiqueNamibiaNepalNetherlandsNew ZealandNicaraguaNigerNigeriaNorth AmericaNorwayOECD membersOmanOther small statesPacific island small statesPakistanPanamaPapua New GuineaParaguayPeruPhilippinesPolandPortugalPost-demographic dividendPre-demographic dividendQatarRomaniaRussian FederationRwandaSaudi ArabiaSenegalSerbiaSeychellesSierra LeoneSingaporeSlovak RepublicSloveniaSmall statesSolomon IslandsSouth AfricaSouth AsiaSouth Asia (IDA & IBRD)South SudanSpainSri LankaSt. Kitts and NevisSt. LuciaSt. Vincent and the GrenadinesSub-Saharan Africa Sub-Saharan Africa (excluding high income)Sub-Saharan Africa (IDA & IBRD countries)SudanSurinameSwazilandSwedenSwitzerlandSyrian Arab RepublicTajikistanTanzaniaThailandTimor-LesteTogoTongaTrinidad and TobagoTunisiaTurkeyUgandaUkraineUnited KingdomUnited StatesUpper middle incomeUruguayVanuatuVenezuela, RBVietnamWest Bank and GazaWorldYemen, Rep.ZambiaZimbabwe Linha do tempo:
Nesta escala de tempo está apresentado um gráfico de 1978 ano até 2015 ano Panama. Dados de 1977 ano ausente. O número de observações reais por data: 38.
Fonte (nome):
Indicadores de desenvolvimento mundial
Fonte (organização):
World Bank national accounts data, and OECD National Accounts data files.
Categorias:
Economy & Growth
Foi atualizado:
23 abr 2017 ano
Indicadores de alterações dos valores ao longo dos anos
Mínimo:
0.354
1 jan 1990 ano
Máximo:
33.251
1 jan 2015 ano
Na data de observação
Valor
Mudança absoluta
A alteração em relação ao valor anterior
1 jan 1978 ano
11.645
+11.645
0.0%
1 jan 1979 ano
14.484
+2.839
24.38%
1 jan 1980 ano
9.303
-5.181
-35.77%
1 jan 1981 ano
17.975
+8.672
93.22%
1 jan 1982 ano
15.543
-2.432
-13.53%
1 jan 1983 ano
24.721
+9.178
59.05%
1 jan 1984 ano
22.79
-1.931
-7.81%
1 jan 1985 ano
11.417
-11.373
-49.9%
1 jan 1986 ano
15.03
+3.612
31.64%
1 jan 1987 ano
12.841
-2.188
-14.56%
1 jan 1988 ano
24.178
+11.337
88.28%
1 jan 1989 ano
11.503
-12.675
-52.42%
1 jan 1990 ano
0.354
-11.15
-96.93%
1 jan 1991 ano
14.338
+13.984
3.95 mil%
1 jan 1992 ano
9.648
-4.69
-32.71%
1 jan 1993 ano
15.372
+5.724
59.33%
1 jan 1994 ano
19.162
+3.789
24.65%
1 jan 1995 ano
22.27
+3.109
16.22%
1 jan 1996 ano
23.1
+0.83
3.73%
1 jan 1997 ano
25.481
+2.381
10.31%
1 jan 1998 ano
24.922
-0.559
-2.2%
1 jan 1999 ano
22.345
-2.577
-10.34%
1 jan 2000 ano
22.026
-0.319
-1.43%
1 jan 2001 ano
24.044
+2.019
9.17%
1 jan 2002 ano
18.217
-5.827
-24.24%
1 jan 2003 ano
17.896
-0.321
-1.76%
1 jan 2004 ano
20.205
+2.309
12.9%
1 jan 2005 ano
15.89
-4.315
-21.36%
1 jan 2006 ano
16.472
+0.582
3.67%
1 jan 2007 ano
19.447
+2.974
18.06%
1 jan 2008 ano
27.103
+7.657
39.37%
1 jan 2009 ano
26.108
-0.995
-3.67%
1 jan 2010 ano
23.68
-2.428
-9.3%
1 jan 2011 ano
18.667
-5.013
-21.17%
1 jan 2012 ano
25.986
+7.319
39.21%
1 jan 2013 ano
29.225
+3.24
12.47%
1 jan 2014 ano
31.314
+2.089
7.15%
1 jan 2015 ano
33.251
+1.937
6.19%
Classificação de países por estatísticas atuais por anos


Comentários: