30
/pt/
AIzaSyAYiBZKx7MnpbEhh9jyipgxe19OcubqV5w
April 1, 2024
265829
Tonga
TON
true
2
1
Gross savings (% of GDP)
2013,2012,2011,2010,2009,2008,2007,2006,2005,2004,2003,2002,1994,1993,1992,1991,1990,1989,1988,1987,1986,1985,1984,1983,1982
Download
Biblioteca de estatísticas globais →Tonga →

Gross savings (% of GDP)

Estas estatísticas em outros países:

AfghanistanAlbaniaAlgeriaAngolaAntigua and BarbudaArab WorldArgentinaArmeniaAustraliaAustriaAzerbaijanBahamas, TheBahrainBangladeshBarbadosBelarusBelgiumBelizeBeninBermudaBhutanBoliviaBosnia and HerzegovinaBotswanaBrazilBrunei DarussalamBulgariaBurkina FasoBurundiCabo VerdeCambodiaCameroonCanadaCaribbean small statesCentral African RepublicCentral Europe and the BalticsChadChileChinaColombiaComorosCongo, Dem. Rep.Congo, Rep.Costa RicaCote d'IvoireCroatiaCyprusCzech RepublicDenmarkDjiboutiDominicaDominican RepublicEarly-demographic dividendEast Asia & PacificEast Asia & Pacific (excluding high income)East Asia & Pacific (IDA & IBRD countries)EcuadorEgypt, Arab Rep.El SalvadorEquatorial GuineaEritreaEstoniaEthiopiaEuro areaEurope & Central AsiaEurope & Central Asia (excluding high income)Europe & Central Asia (IDA & IBRD countries)European UnionFaroe IslandsFijiFinlandFragile and conflict affected situationsFranceGabonGambia, TheGeorgiaGermanyGhanaGreeceGrenadaGuatemalaGuineaGuinea-BissauGuyanaHaitiHeavily indebted poor countries (HIPC)High incomeHondurasHong Kong SAR, ChinaHungaryIBRD onlyIcelandIDA & IBRD totalIDA blendIDA onlyIDA totalIndiaIndonesiaIran, Islamic Rep.IraqIrelandIsraelItalyJamaicaJapanJordanKazakhstanKenyaKiribatiKorea, Rep.KosovoKuwaitKyrgyz RepublicLao PDRLate-demographic dividendLatin America & Caribbean Latin America & Caribbean (excluding high income)Latin America & the Caribbean (IDA & IBRD countries)LatviaLeast developed countries: UN classificationLebanonLesothoLiberiaLibyaLithuaniaLow & middle incomeLow incomeLower middle incomeLuxembourgMacao SAR, ChinaMacedonia, FYRMadagascarMalawiMalaysiaMaldivesMaliMaltaMauritaniaMauritiusMexicoMiddle East & North AfricaMiddle East & North Africa (excluding high income)Middle East & North Africa (IDA & IBRD countries)Middle incomeMoldovaMongoliaMontenegroMoroccoMozambiqueNamibiaNepalNetherlandsNew ZealandNicaraguaNigerNigeriaNorth AmericaNorwayOECD membersOmanOther small statesPacific island small statesPakistanPanamaPapua New GuineaParaguayPeruPhilippinesPolandPortugalPost-demographic dividendPre-demographic dividendQatarRomaniaRussian FederationRwandaSaudi ArabiaSenegalSerbiaSeychellesSierra LeoneSingaporeSlovak RepublicSloveniaSmall statesSolomon IslandsSouth AfricaSouth AsiaSouth Asia (IDA & IBRD)South SudanSpainSri LankaSt. Kitts and NevisSt. LuciaSt. Vincent and the GrenadinesSub-Saharan Africa Sub-Saharan Africa (excluding high income)Sub-Saharan Africa (IDA & IBRD countries)SudanSurinameSwazilandSwedenSwitzerlandSyrian Arab RepublicTajikistanTanzaniaThailandTimor-LesteTogoTongaTrinidad and TobagoTunisiaTurkeyUgandaUkraineUnited KingdomUnited StatesUpper middle incomeUruguayVanuatuVenezuela, RBVietnamWest Bank and GazaWorldYemen, Rep.ZambiaZimbabwe

Linha do tempo:

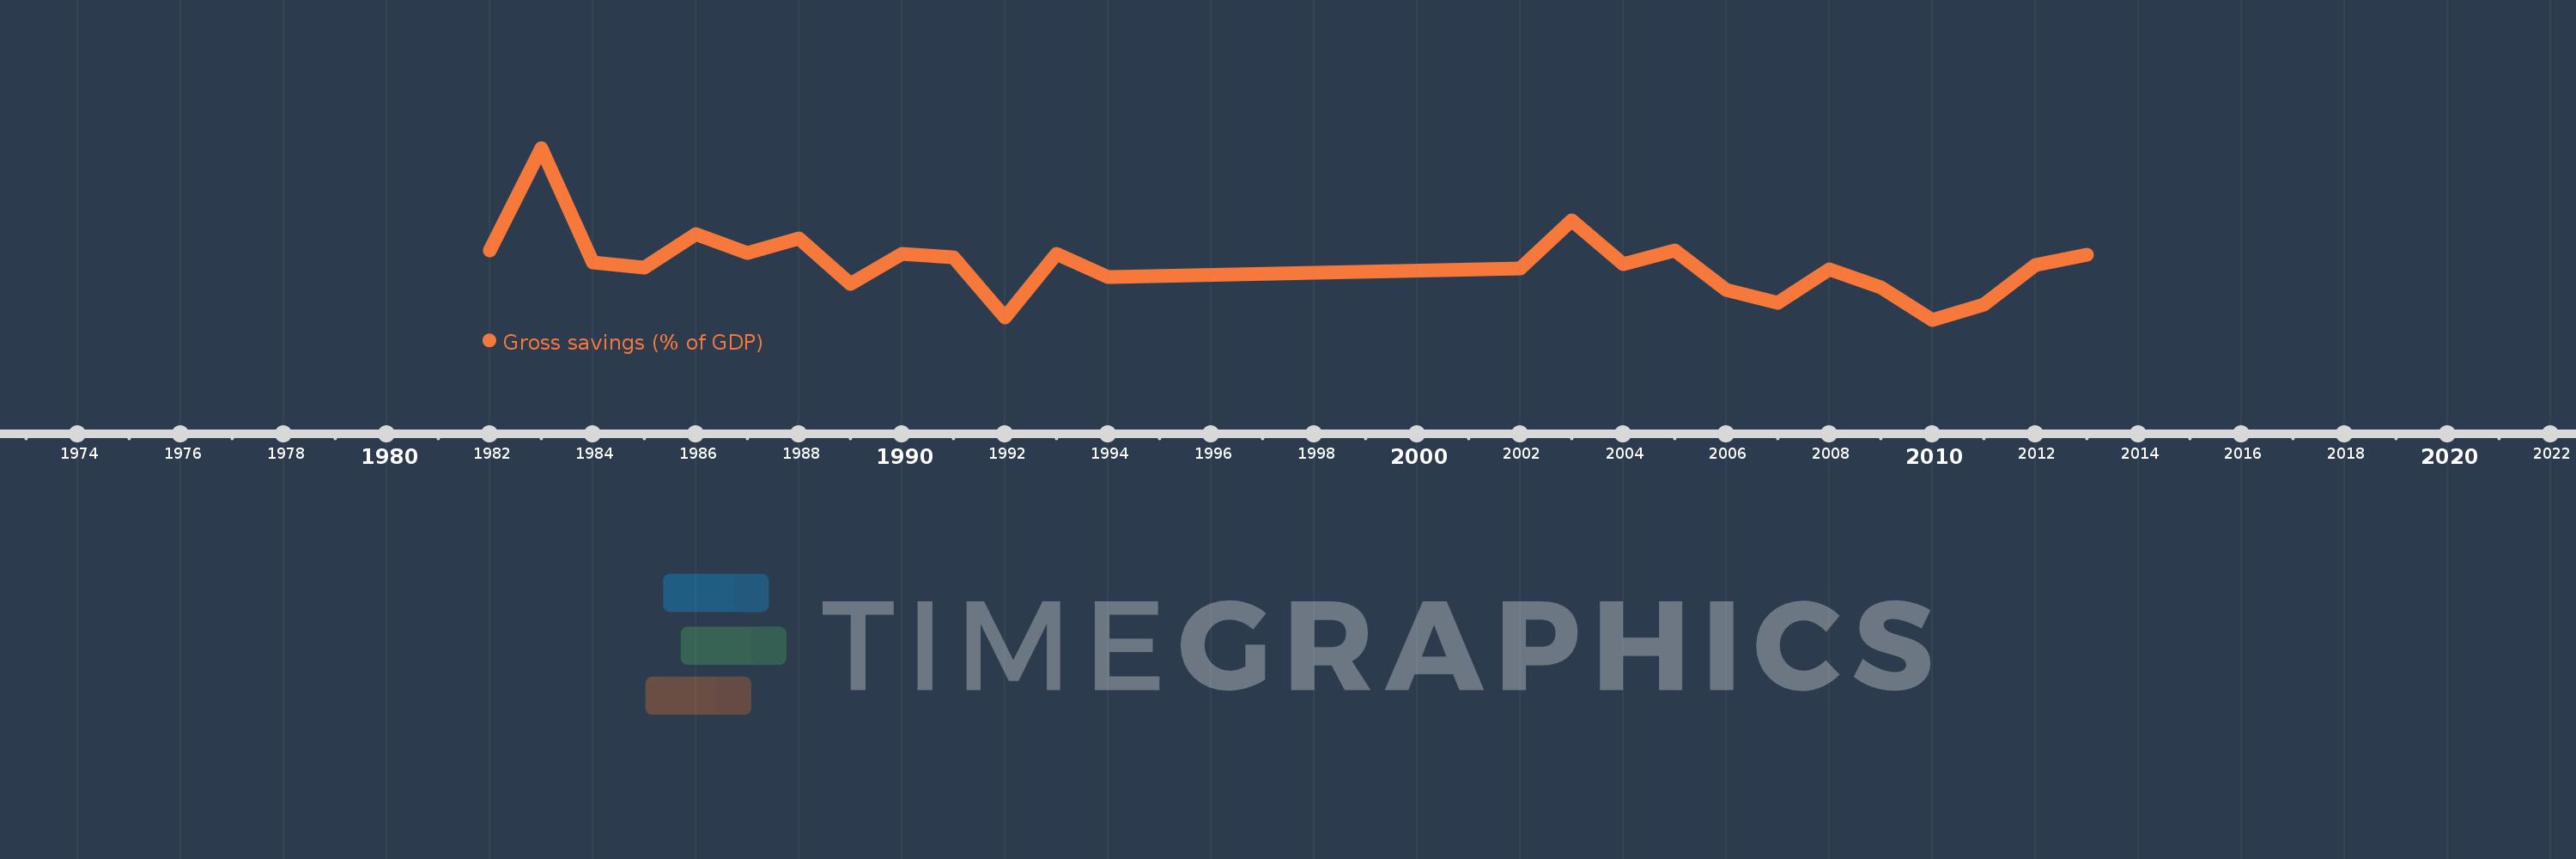
Nesta escala de tempo está apresentado um gráfico de 1982 ano até 2013 ano Tonga. Dados de 1981 ano ausente. O número de observações reais por data: 25.

Fonte (nome):

Indicadores de desenvolvimento mundial

Fonte (organização):

World Bank national accounts data, and OECD National Accounts data files.

Categorias:

Economy & Growth

Foi atualizado:

23 abr 2017 ano

Indicadores de alterações dos valores ao longo dos anos

Em média:
21.031
Mínimo:
7.031
1 jan 2010 ano
Máximo:
50.009
1 jan 1983 ano
Na data de observação
Valor
Mudança absoluta
A alteração em relação ao valor anterior
1 jan 1982 ano
24.39
+24.39
0.0%
1 jan 1983 ano
50.009
+25.618
105.03%
1 jan 1984 ano
21.39
-28.619
-57.23%
1 jan 1985 ano
20.069
-1.321
-6.17%
1 jan 1986 ano
28.555
+8.485
42.28%
1 jan 1987 ano
23.802
-4.753
-16.64%
1 jan 1988 ano
27.35
+3.549
14.91%
1 jan 1989 ano
16.078
-11.273
-41.22%
1 jan 1990 ano
23.455
+7.377
45.89%
1 jan 1991 ano
22.757
-0.698
-2.97%
1 jan 1992 ano
7.697
-15.06
-66.18%
1 jan 1993 ano
23.479
+15.782
205.05%
1 jan 1994 ano
17.649
-5.83
-24.83%
1 jan 2002 ano
19.789
+2.14
12.12%
1 jan 2003 ano
31.82
+12.031
60.8%
1 jan 2004 ano
20.968
-10.852
-34.11%
1 jan 2005 ano
24.328
+3.36
16.02%
1 jan 2006 ano
14.39
-9.938
-40.85%
1 jan 2007 ano
11.326
-3.063
-21.29%
1 jan 2008 ano
19.742
+8.415
74.3%
1 jan 2009 ano
15.026
-4.715
-23.88%
1 jan 2010 ano
7.031
-7.996
-53.21%
1 jan 2011 ano
10.785
+3.754
53.4%
1 jan 2012 ano
20.665
+9.881
91.62%
1 jan 2013 ano
23.215
+2.55
12.34%

Classificação de países por estatísticas atuais por anos