29
/pt/
pt
AIzaSyAYiBZKx7MnpbEhh9jyipgxe19OcubqV5w
April 1, 2024
210444
Nicaragua
NIC
true
2
1
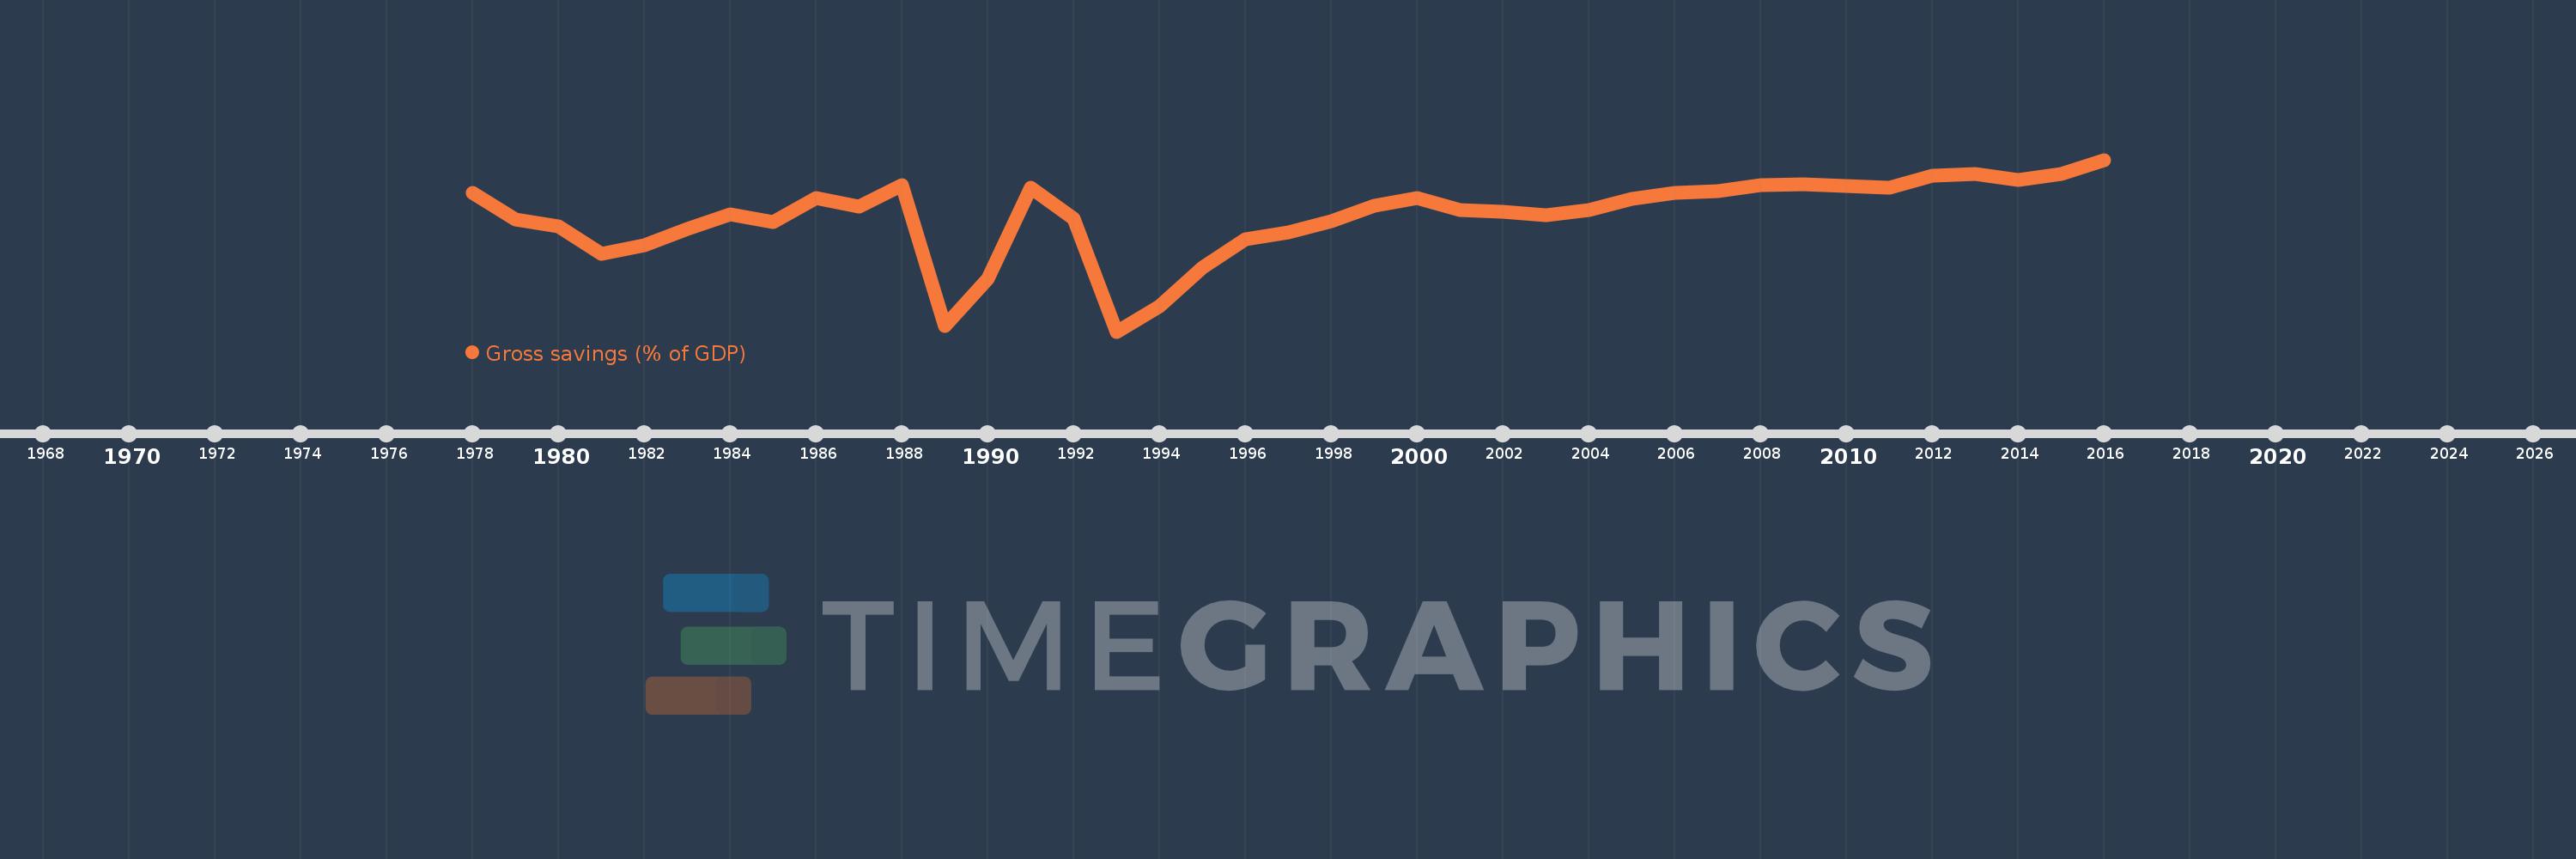
Gross savings (% of GDP)
2016,2015,2014,2013,2012,2011,2010,2009,2008,2007,2006,2005,2004,2003,2002,2001,2000,1999,1998,1997,1996,1995,1994,1993,1992,1991,1990,1989,1988,1987,1986,1985,1984,1983,1982,1981,1980,1979,1978
Estas estatísticas em outros países:
AfghanistanAlbaniaAlgeriaAngolaAntigua and BarbudaArab WorldArgentinaArmeniaAustraliaAustriaAzerbaijanBahamas, TheBahrainBangladeshBarbadosBelarusBelgiumBelizeBeninBermudaBhutanBoliviaBosnia and HerzegovinaBotswanaBrazilBrunei DarussalamBulgariaBurkina FasoBurundiCabo VerdeCambodiaCameroonCanadaCaribbean small statesCentral African RepublicCentral Europe and the BalticsChadChileChinaColombiaComorosCongo, Dem. Rep.Congo, Rep.Costa RicaCote d'IvoireCroatiaCyprusCzech RepublicDenmarkDjiboutiDominicaDominican RepublicEarly-demographic dividendEast Asia & PacificEast Asia & Pacific (excluding high income)East Asia & Pacific (IDA & IBRD countries)EcuadorEgypt, Arab Rep.El SalvadorEquatorial GuineaEritreaEstoniaEthiopiaEuro areaEurope & Central AsiaEurope & Central Asia (excluding high income)Europe & Central Asia (IDA & IBRD countries)European UnionFaroe IslandsFijiFinlandFragile and conflict affected situationsFranceGabonGambia, TheGeorgiaGermanyGhanaGreeceGrenadaGuatemalaGuineaGuinea-BissauGuyanaHaitiHeavily indebted poor countries (HIPC)High incomeHondurasHong Kong SAR, ChinaHungaryIBRD onlyIcelandIDA & IBRD totalIDA blendIDA onlyIDA totalIndiaIndonesiaIran, Islamic Rep.IraqIrelandIsraelItalyJamaicaJapanJordanKazakhstanKenyaKiribatiKorea, Rep.KosovoKuwaitKyrgyz RepublicLao PDRLate-demographic dividendLatin America & Caribbean Latin America & Caribbean (excluding high income)Latin America & the Caribbean (IDA & IBRD countries)LatviaLeast developed countries: UN classificationLebanonLesothoLiberiaLibyaLithuaniaLow & middle incomeLow incomeLower middle incomeLuxembourgMacao SAR, ChinaMacedonia, FYRMadagascarMalawiMalaysiaMaldivesMaliMaltaMauritaniaMauritiusMexicoMiddle East & North AfricaMiddle East & North Africa (excluding high income)Middle East & North Africa (IDA & IBRD countries)Middle incomeMoldovaMongoliaMontenegroMoroccoMozambiqueNamibiaNepalNetherlandsNew ZealandNicaraguaNigerNigeriaNorth AmericaNorwayOECD membersOmanOther small statesPacific island small statesPakistanPanamaPapua New GuineaParaguayPeruPhilippinesPolandPortugalPost-demographic dividendPre-demographic dividendQatarRomaniaRussian FederationRwandaSaudi ArabiaSenegalSerbiaSeychellesSierra LeoneSingaporeSlovak RepublicSloveniaSmall statesSolomon IslandsSouth AfricaSouth AsiaSouth Asia (IDA & IBRD)South SudanSpainSri LankaSt. Kitts and NevisSt. LuciaSt. Vincent and the GrenadinesSub-Saharan Africa Sub-Saharan Africa (excluding high income)Sub-Saharan Africa (IDA & IBRD countries)SudanSurinameSwazilandSwedenSwitzerlandSyrian Arab RepublicTajikistanTanzaniaThailandTimor-LesteTogoTongaTrinidad and TobagoTunisiaTurkeyUgandaUkraineUnited KingdomUnited StatesUpper middle incomeUruguayVanuatuVenezuela, RBVietnamWest Bank and GazaWorldYemen, Rep.ZambiaZimbabwe Linha do tempo:
Nesta escala de tempo está apresentado um gráfico de 1978 ano até 2016 ano Nicaragua. Dados de 1977 ano ausente. O número de observações reais por data: 39.
Fonte (nome):
Indicadores de desenvolvimento mundial
Fonte (organização):
World Bank national accounts data, and OECD National Accounts data files.
Categorias:
Economy & Growth
Foi atualizado:
23 abr 2017 ano
Indicadores de alterações dos valores ao longo dos anos
Mínimo:
-24.004
1 jan 1993 ano
Máximo:
23.428
1 jan 2016 ano
Na data de observação
Valor
Mudança absoluta
A alteração em relação ao valor anterior
1 jan 1978 ano
14.412
+14.412
0.0%
1 jan 1979 ano
6.874
-7.539
-52.31%
1 jan 1980 ano
5.123
-1.751
-25.47%
1 jan 1981 ano
-2.443
-7.566
-147.69%
1 jan 1982 ano
-0.258
+2.185
-89.43%
1 jan 1983 ano
4.328
+4.586
-1.78 mil%
1 jan 1984 ano
8.352
+4.024
92.99%
1 jan 1985 ano
6.27
-2.083
-24.94%
1 jan 1986 ano
12.833
+6.564
104.69%
1 jan 1987 ano
10.46
-2.373
-18.49%
1 jan 1988 ano
16.484
+6.024
57.6%
1 jan 1989 ano
-22.548
-39.032
-236.79%
1 jan 1990 ano
-9.478
+13.071
-57.97%
1 jan 1991 ano
15.705
+25.183
-265.71%
1 jan 1992 ano
7.216
-8.49
-54.06%
1 jan 1993 ano
-24.004
-31.22
-432.66%
1 jan 1994 ano
-16.965
+7.039
-29.32%
1 jan 1995 ano
-6.254
+10.712
-63.14%
1 jan 1996 ano
1.464
+7.717
-123.41%
1 jan 1997 ano
3.343
+1.879
128.39%
1 jan 1998 ano
6.438
+3.095
92.58%
1 jan 1999 ano
10.629
+4.191
65.1%
1 jan 2000 ano
12.948
+2.319
21.81%
1 jan 2001 ano
9.653
-3.295
-25.45%
1 jan 2002 ano
9.021
-0.632
-6.55%
1 jan 2003 ano
8.245
-0.776
-8.6%
1 jan 2004 ano
9.512
+1.267
15.37%
1 jan 2005 ano
12.748
+3.236
34.02%
1 jan 2006 ano
14.194
+1.446
11.35%
1 jan 2007 ano
14.68
+0.486
3.42%
1 jan 2008 ano
16.547
+1.867
12.72%
1 jan 2009 ano
16.681
+0.134
0.81%
1 jan 2010 ano
16.133
-0.548
-3.28%
1 jan 2011 ano
15.62
-0.513
-3.18%
1 jan 2012 ano
19.071
+3.45
22.09%
1 jan 2013 ano
19.557
+0.487
2.55%
1 jan 2014 ano
17.838
-1.719
-8.79%
1 jan 2015 ano
19.441
+1.603
8.98%
1 jan 2016 ano
23.428
+3.987
20.51%
Classificação de países por estatísticas atuais por anos


Comentários: