29
/pt/
pt
AIzaSyAYiBZKx7MnpbEhh9jyipgxe19OcubqV5w
April 1, 2024
78744
Bangladesh
BGD
true
2
1
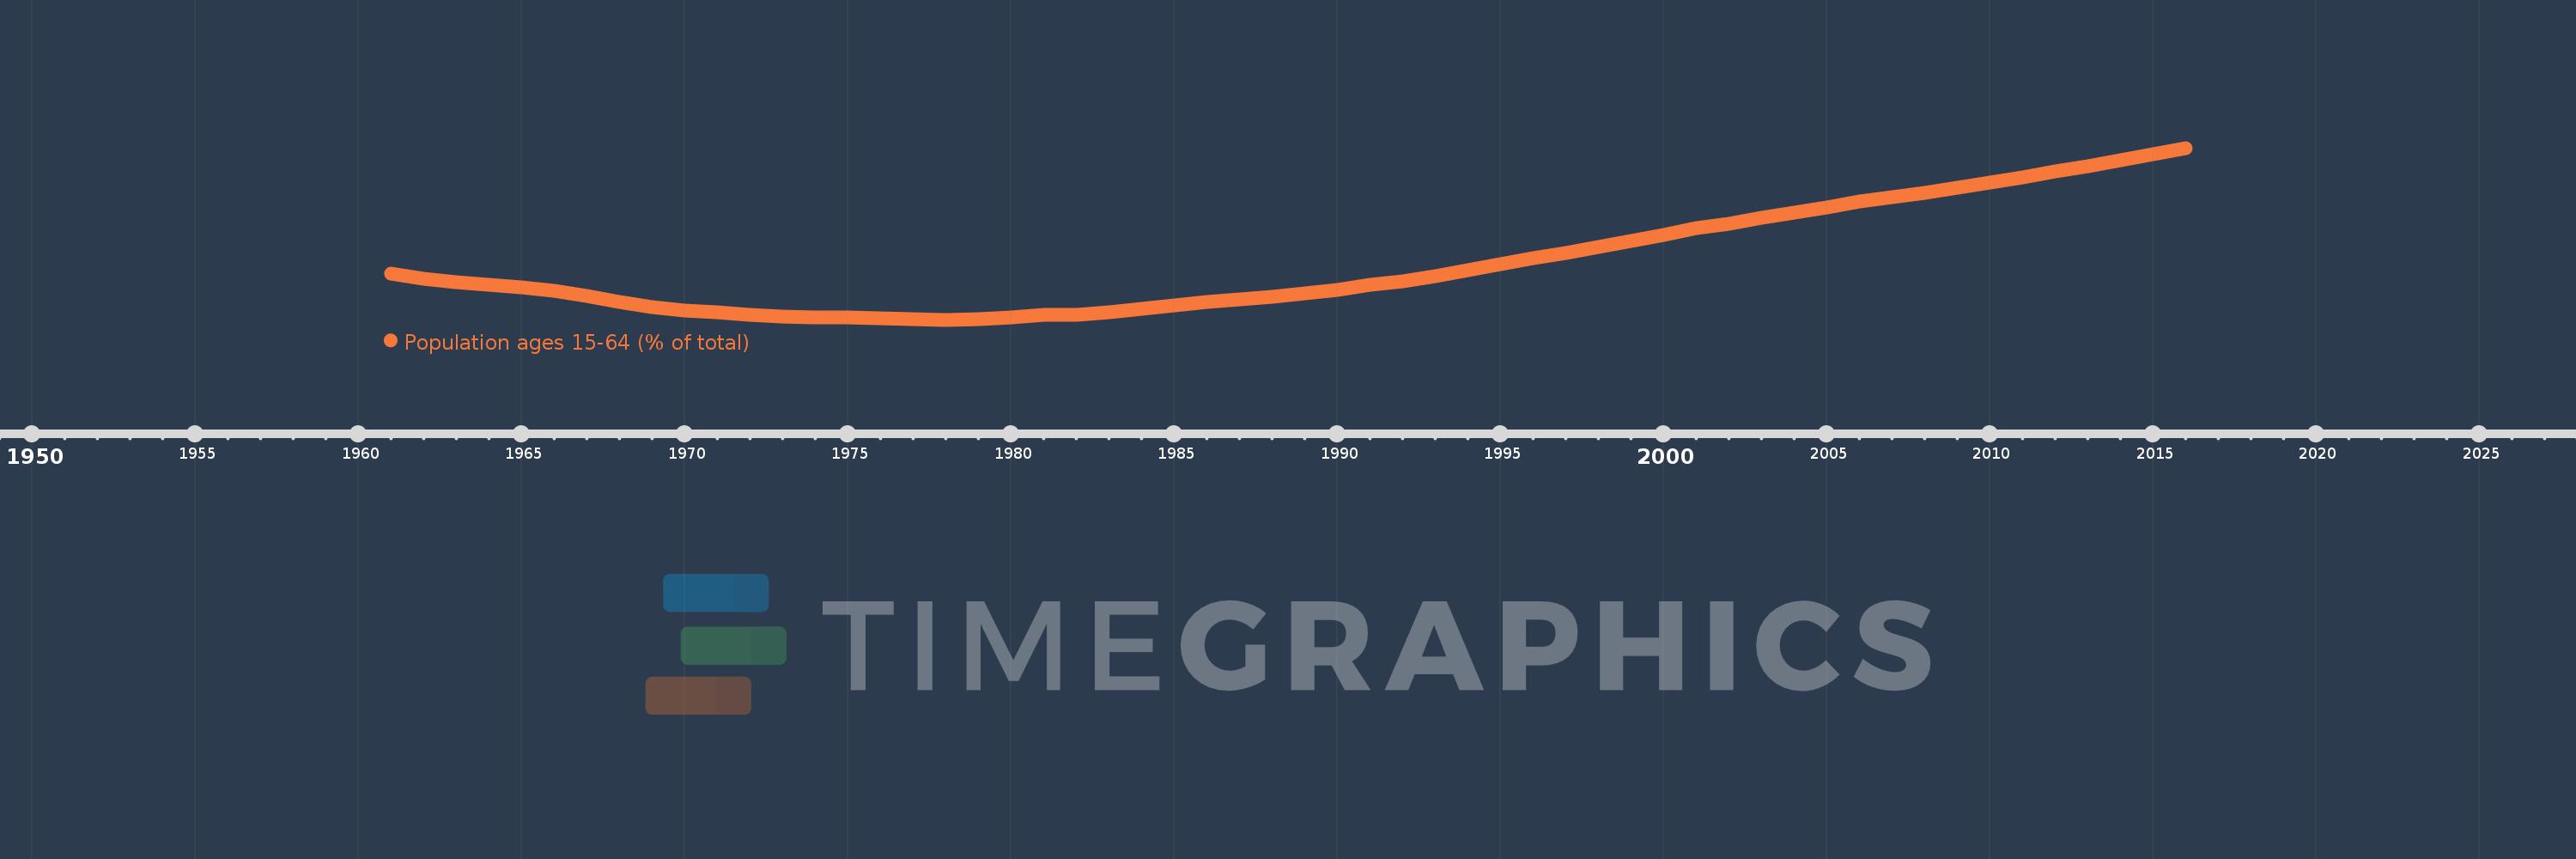
Population ages 15-64 (% of total)
2016,2015,2014,2013,2012,2011,2010,2009,2008,2007,2006,2005,2004,2003,2002,2001,2000,1999,1998,1997,1996,1995,1994,1993,1992,1991,1990,1989,1988,1987,1986,1985,1984,1983,1982,1981,1980,1979,1978,1977,1976,1975,1974,1973,1972,1971,1970,1969,1968,1967,1966,1965,1964,1963,1962,1961
Estas estatísticas em outros países:
AfghanistanAlbaniaAlgeriaAngolaAntigua and BarbudaArab WorldArgentinaArmeniaArubaAustraliaAustriaAzerbaijanBahamas, TheBahrainBangladeshBarbadosBelarusBelgiumBelizeBeninBhutanBoliviaBosnia and HerzegovinaBotswanaBrazilBrunei DarussalamBulgariaBurkina FasoBurundiCabo VerdeCambodiaCameroonCanadaCaribbean small statesCentral African RepublicCentral Europe and the BalticsChadChannel IslandsChileChinaColombiaComorosCongo, Dem. Rep.Congo, Rep.Costa RicaCote d'IvoireCroatiaCubaCuracaoCyprusCzech RepublicDenmarkDjiboutiDominican RepublicEarly-demographic dividendEast Asia & PacificEast Asia & Pacific (excluding high income)East Asia & Pacific (IDA & IBRD countries)EcuadorEgypt, Arab Rep.El SalvadorEquatorial GuineaEritreaEstoniaEthiopiaEuro areaEurope & Central AsiaEurope & Central Asia (excluding high income)Europe & Central Asia (IDA & IBRD countries)European UnionFijiFinlandFragile and conflict affected situationsFranceFrench PolynesiaGabonGambia, TheGeorgiaGermanyGhanaGreeceGrenadaGuamGuatemalaGuineaGuinea-BissauGuyanaHaitiHeavily indebted poor countries (HIPC)High incomeHondurasHong Kong SAR, ChinaHungaryIBRD onlyIcelandIDA & IBRD totalIDA blendIDA onlyIDA totalIndiaIndonesiaIran, Islamic Rep.IraqIrelandIsraelItalyJamaicaJapanJordanKazakhstanKenyaKiribatiKorea, Dem. People’s Rep.Korea, Rep.KosovoKuwaitKyrgyz RepublicLao PDRLate-demographic dividendLatin America & Caribbean Latin America & Caribbean (excluding high income)Latin America & the Caribbean (IDA & IBRD countries)LatviaLeast developed countries: UN classificationLebanonLesothoLiberiaLibyaLithuaniaLow & middle incomeLow incomeLower middle incomeLuxembourgMacao SAR, ChinaMacedonia, FYRMadagascarMalawiMalaysiaMaldivesMaliMaltaMauritaniaMauritiusMexicoMicronesia, Fed. Sts.Middle East & North AfricaMiddle East & North Africa (excluding high income)Middle East & North Africa (IDA & IBRD countries)Middle incomeMoldovaMongoliaMontenegroMoroccoMozambiqueMyanmarNamibiaNepalNetherlandsNew CaledoniaNew ZealandNicaraguaNigerNigeriaNorth AmericaNorwayOECD membersOmanOther small statesPacific island small statesPakistanPanamaPapua New GuineaParaguayPeruPhilippinesPolandPortugalPost-demographic dividendPre-demographic dividendPuerto RicoQatarRomaniaRussian FederationRwandaSamoaSao Tome and PrincipeSaudi ArabiaSenegalSerbiaSeychellesSierra LeoneSingaporeSlovak RepublicSloveniaSmall statesSolomon IslandsSomaliaSouth AfricaSouth AsiaSouth Asia (IDA & IBRD)South SudanSpainSri LankaSt. LuciaSt. Vincent and the GrenadinesSub-Saharan Africa Sub-Saharan Africa (excluding high income)Sub-Saharan Africa (IDA & IBRD countries)SudanSurinameSwazilandSwedenSwitzerlandSyrian Arab RepublicTajikistanTanzaniaThailandTimor-LesteTogoTongaTrinidad and TobagoTunisiaTurkeyTurkmenistanUgandaUkraineUnited Arab EmiratesUnited KingdomUnited StatesUpper middle incomeUruguayUzbekistanVanuatuVenezuela, RBVietnamVirgin Islands (U.S.)West Bank and GazaWorldYemen, Rep.ZambiaZimbabwe Linha do tempo:
Nesta escala de tempo está apresentado um gráfico de 1961 ano até 2016 ano Bangladesh. Dados de 1960 ano ausente. O número de observações reais por data: 56.
Fonte (nome):
Indicadores de desenvolvimento mundial
Fonte (organização):
World Bank staff estimates based on age distributions of United Nations Population Division's World Population Prospects.
Categorias:
Education, Health
Foi atualizado:
23 abr 2017 ano
Indicadores de alterações dos valores ao longo dos anos
Mínimo:
51.737
1 jan 1978 ano
Máximo:
65.579
1 jan 2016 ano
Na data de observação
Valor
Mudança absoluta
A alteração em relação ao valor anterior
1 jan 1961 ano
55.464
+55.464
0.0%
1 jan 1962 ano
55.051
-0.413
-0.74%
1 jan 1963 ano
54.775
-0.276
-0.5%
1 jan 1964 ano
54.57
-0.206
-0.38%
1 jan 1965 ano
54.348
-0.221
-0.41%
1 jan 1966 ano
54.077
-0.271
-0.5%
1 jan 1967 ano
53.63
-0.447
-0.83%
1 jan 1968 ano
53.176
-0.455
-0.85%
1 jan 1969 ano
52.757
-0.419
-0.79%
1 jan 1970 ano
52.461
-0.296
-0.56%
1 jan 1971 ano
52.348
-0.113
-0.22%
1 jan 1972 ano
52.113
-0.235
-0.45%
1 jan 1973 ano
51.983
-0.13
-0.25%
1 jan 1974 ano
51.938
-0.045
-0.09%
1 jan 1975 ano
51.914
-0.024
-0.05%
1 jan 1976 ano
51.869
-0.045
-0.09%
1 jan 1977 ano
51.765
-0.104
-0.2%
1 jan 1978 ano
51.737
-0.028
-0.05%
1 jan 1979 ano
51.774
+0.038
0.07%
1 jan 1980 ano
51.895
+0.12
0.23%
1 jan 1981 ano
52.101
+0.206
0.4%
1 jan 1982 ano
52.136
+0.035
0.07%
1 jan 1983 ano
52.318
+0.182
0.35%
1 jan 1984 ano
52.59
+0.273
0.52%
1 jan 1985 ano
52.884
+0.294
0.56%
1 jan 1986 ano
53.171
+0.286
0.54%
1 jan 1987 ano
53.375
+0.204
0.38%
1 jan 1988 ano
53.59
+0.215
0.4%
1 jan 1989 ano
53.834
+0.244
0.46%
1 jan 1990 ano
54.147
+0.313
0.58%
1 jan 1991 ano
54.545
+0.399
0.74%
1 jan 1992 ano
54.864
+0.319
0.58%
1 jan 1993 ano
55.259
+0.394
0.72%
1 jan 1994 ano
55.711
+0.452
0.82%
1 jan 1995 ano
56.196
+0.485
0.87%
1 jan 1996 ano
56.697
+0.502
0.89%
1 jan 1997 ano
57.143
+0.446
0.79%
1 jan 1998 ano
57.609
+0.466
0.82%
1 jan 1999 ano
58.093
+0.483
0.84%
1 jan 2000 ano
58.591
+0.499
0.86%
1 jan 2001 ano
59.103
+0.511
0.87%
1 jan 2002 ano
59.5
+0.397
0.67%
1 jan 2003 ano
59.924
+0.424
0.71%
1 jan 2004 ano
60.365
+0.441
0.74%
1 jan 2005 ano
60.815
+0.45
0.75%
1 jan 2006 ano
61.274
+0.459
0.75%
1 jan 2007 ano
61.618
+0.344
0.56%
1 jan 2008 ano
61.986
+0.369
0.6%
1 jan 2009 ano
62.375
+0.389
0.63%
1 jan 2010 ano
62.776
+0.401
0.64%
1 jan 2011 ano
63.186
+0.41
0.65%
1 jan 2012 ano
63.67
+0.484
0.77%
1 jan 2013 ano
64.131
+0.461
0.72%
1 jan 2014 ano
64.588
+0.457
0.71%
1 jan 2015 ano
65.068
+0.48
0.74%
1 jan 2016 ano
65.579
+0.512
0.79%
Classificação de países por estatísticas atuais por anos


Comentários: