29
/pt/
pt
AIzaSyAYiBZKx7MnpbEhh9jyipgxe19OcubqV5w
April 1, 2024
173343
Kyrgyz Republic
KGZ
true
2
1
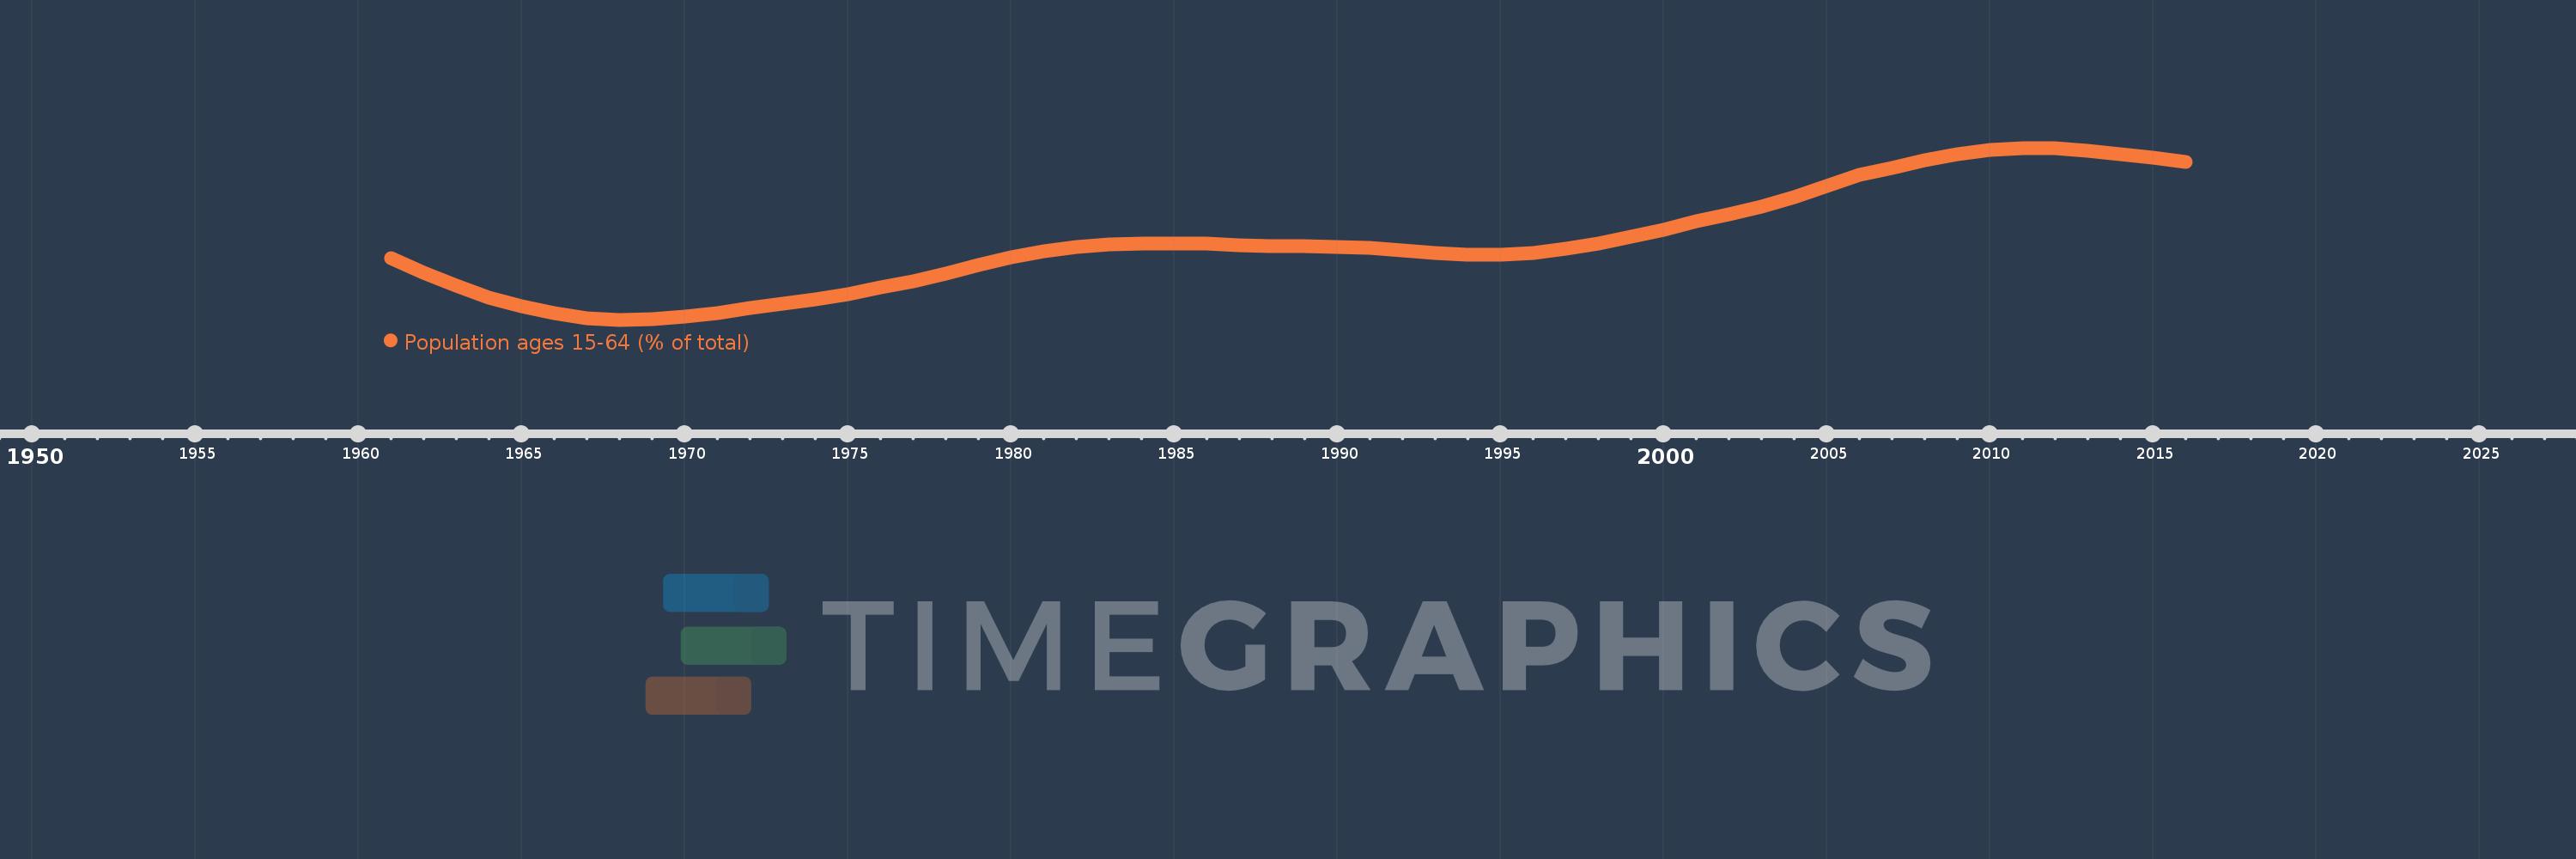
Population ages 15-64 (% of total)
2016,2015,2014,2013,2012,2011,2010,2009,2008,2007,2006,2005,2004,2003,2002,2001,2000,1999,1998,1997,1996,1995,1994,1993,1992,1991,1990,1989,1988,1987,1986,1985,1984,1983,1982,1981,1980,1979,1978,1977,1976,1975,1974,1973,1972,1971,1970,1969,1968,1967,1966,1965,1964,1963,1962,1961
Estas estatísticas em outros países:
AfghanistanAlbaniaAlgeriaAngolaAntigua and BarbudaArab WorldArgentinaArmeniaArubaAustraliaAustriaAzerbaijanBahamas, TheBahrainBangladeshBarbadosBelarusBelgiumBelizeBeninBhutanBoliviaBosnia and HerzegovinaBotswanaBrazilBrunei DarussalamBulgariaBurkina FasoBurundiCabo VerdeCambodiaCameroonCanadaCaribbean small statesCentral African RepublicCentral Europe and the BalticsChadChannel IslandsChileChinaColombiaComorosCongo, Dem. Rep.Congo, Rep.Costa RicaCote d'IvoireCroatiaCubaCuracaoCyprusCzech RepublicDenmarkDjiboutiDominican RepublicEarly-demographic dividendEast Asia & PacificEast Asia & Pacific (excluding high income)East Asia & Pacific (IDA & IBRD countries)EcuadorEgypt, Arab Rep.El SalvadorEquatorial GuineaEritreaEstoniaEthiopiaEuro areaEurope & Central AsiaEurope & Central Asia (excluding high income)Europe & Central Asia (IDA & IBRD countries)European UnionFijiFinlandFragile and conflict affected situationsFranceFrench PolynesiaGabonGambia, TheGeorgiaGermanyGhanaGreeceGrenadaGuamGuatemalaGuineaGuinea-BissauGuyanaHaitiHeavily indebted poor countries (HIPC)High incomeHondurasHong Kong SAR, ChinaHungaryIBRD onlyIcelandIDA & IBRD totalIDA blendIDA onlyIDA totalIndiaIndonesiaIran, Islamic Rep.IraqIrelandIsraelItalyJamaicaJapanJordanKazakhstanKenyaKiribatiKorea, Dem. People’s Rep.Korea, Rep.KosovoKuwaitKyrgyz RepublicLao PDRLate-demographic dividendLatin America & Caribbean Latin America & Caribbean (excluding high income)Latin America & the Caribbean (IDA & IBRD countries)LatviaLeast developed countries: UN classificationLebanonLesothoLiberiaLibyaLithuaniaLow & middle incomeLow incomeLower middle incomeLuxembourgMacao SAR, ChinaMacedonia, FYRMadagascarMalawiMalaysiaMaldivesMaliMaltaMauritaniaMauritiusMexicoMicronesia, Fed. Sts.Middle East & North AfricaMiddle East & North Africa (excluding high income)Middle East & North Africa (IDA & IBRD countries)Middle incomeMoldovaMongoliaMontenegroMoroccoMozambiqueMyanmarNamibiaNepalNetherlandsNew CaledoniaNew ZealandNicaraguaNigerNigeriaNorth AmericaNorwayOECD membersOmanOther small statesPacific island small statesPakistanPanamaPapua New GuineaParaguayPeruPhilippinesPolandPortugalPost-demographic dividendPre-demographic dividendPuerto RicoQatarRomaniaRussian FederationRwandaSamoaSao Tome and PrincipeSaudi ArabiaSenegalSerbiaSeychellesSierra LeoneSingaporeSlovak RepublicSloveniaSmall statesSolomon IslandsSomaliaSouth AfricaSouth AsiaSouth Asia (IDA & IBRD)South SudanSpainSri LankaSt. LuciaSt. Vincent and the GrenadinesSub-Saharan Africa Sub-Saharan Africa (excluding high income)Sub-Saharan Africa (IDA & IBRD countries)SudanSurinameSwazilandSwedenSwitzerlandSyrian Arab RepublicTajikistanTanzaniaThailandTimor-LesteTogoTongaTrinidad and TobagoTunisiaTurkeyTurkmenistanUgandaUkraineUnited Arab EmiratesUnited KingdomUnited StatesUpper middle incomeUruguayUzbekistanVanuatuVenezuela, RBVietnamVirgin Islands (U.S.)West Bank and GazaWorldYemen, Rep.ZambiaZimbabwe Linha do tempo:
Nesta escala de tempo está apresentado um gráfico de 1961 ano até 2016 ano Kyrgyz Republic. Dados de 1960 ano ausente. O número de observações reais por data: 56.
Fonte (nome):
Indicadores de desenvolvimento mundial
Fonte (organização):
World Bank staff estimates based on age distributions of United Nations Population Division's World Population Prospects.
Categorias:
Education, Health
Foi atualizado:
23 abr 2017 ano
Indicadores de alterações dos valores ao longo dos anos
Mínimo:
51.57
1 jan 1968 ano
Máximo:
65.542
1 jan 2011 ano
Na data de observação
Valor
Mudança absoluta
A alteração em relação ao valor anterior
1 jan 1961 ano
56.561
+56.561
0.0%
1 jan 1962 ano
55.388
-1.173
-2.07%
1 jan 1963 ano
54.321
-1.067
-1.93%
1 jan 1964 ano
53.393
-0.928
-1.71%
1 jan 1965 ano
52.652
-0.74
-1.39%
1 jan 1966 ano
52.135
-0.518
-0.98%
1 jan 1967 ano
51.72
-0.415
-0.8%
1 jan 1968 ano
51.57
-0.15
-0.29%
1 jan 1969 ano
51.636
+0.066
0.13%
1 jan 1970 ano
51.833
+0.197
0.38%
1 jan 1971 ano
52.108
+0.275
0.53%
1 jan 1972 ano
52.553
+0.445
0.85%
1 jan 1973 ano
52.911
+0.358
0.68%
1 jan 1974 ano
53.243
+0.332
0.63%
1 jan 1975 ano
53.654
+0.411
0.77%
1 jan 1976 ano
54.197
+0.543
1.01%
1 jan 1977 ano
54.667
+0.47
0.87%
1 jan 1978 ano
55.302
+0.635
1.16%
1 jan 1979 ano
56.007
+0.705
1.28%
1 jan 1980 ano
56.634
+0.627
1.12%
1 jan 1981 ano
57.108
+0.473
0.84%
1 jan 1982 ano
57.488
+0.38
0.67%
1 jan 1983 ano
57.686
+0.198
0.34%
1 jan 1984 ano
57.74
+0.054
0.09%
1 jan 1985 ano
57.753
+0.013
0.02%
1 jan 1986 ano
57.788
+0.036
0.06%
1 jan 1987 ano
57.64
-0.148
-0.26%
1 jan 1988 ano
57.568
-0.073
-0.13%
1 jan 1989 ano
57.537
-0.031
-0.05%
1 jan 1990 ano
57.493
-0.043
-0.08%
1 jan 1991 ano
57.427
-0.066
-0.11%
1 jan 1992 ano
57.185
-0.242
-0.42%
1 jan 1993 ano
57.001
-0.184
-0.32%
1 jan 1994 ano
56.891
-0.11
-0.19%
1 jan 1995 ano
56.884
-0.007
-0.01%
1 jan 1996 ano
56.993
+0.109
0.19%
1 jan 1997 ano
57.351
+0.357
0.63%
1 jan 1998 ano
57.789
+0.439
0.77%
1 jan 1999 ano
58.299
+0.51
0.88%
1 jan 2000 ano
58.882
+0.583
1.0%
1 jan 2001 ano
59.551
+0.669
1.14%
1 jan 2002 ano
60.122
+0.571
0.96%
1 jan 2003 ano
60.781
+0.659
1.1%
1 jan 2004 ano
61.556
+0.775
1.28%
1 jan 2005 ano
62.425
+0.869
1.41%
1 jan 2006 ano
63.322
+0.897
1.44%
1 jan 2007 ano
63.926
+0.604
0.95%
1 jan 2008 ano
64.515
+0.589
0.92%
1 jan 2009 ano
65.012
+0.496
0.77%
1 jan 2010 ano
65.359
+0.347
0.53%
1 jan 2011 ano
65.542
+0.184
0.28%
1 jan 2012 ano
65.516
-0.026
-0.04%
1 jan 2013 ano
65.337
-0.179
-0.27%
1 jan 2014 ano
65.051
-0.286
-0.44%
1 jan 2015 ano
64.718
-0.333
-0.51%
1 jan 2016 ano
64.372
-0.347
-0.54%
Classificação de países por estatísticas atuais por anos


Comentários: