29
/pt/
pt
AIzaSyAYiBZKx7MnpbEhh9jyipgxe19OcubqV5w
April 1, 2024
28522
East Asia & Pacific (excluding high income)
EAP
false
2
1
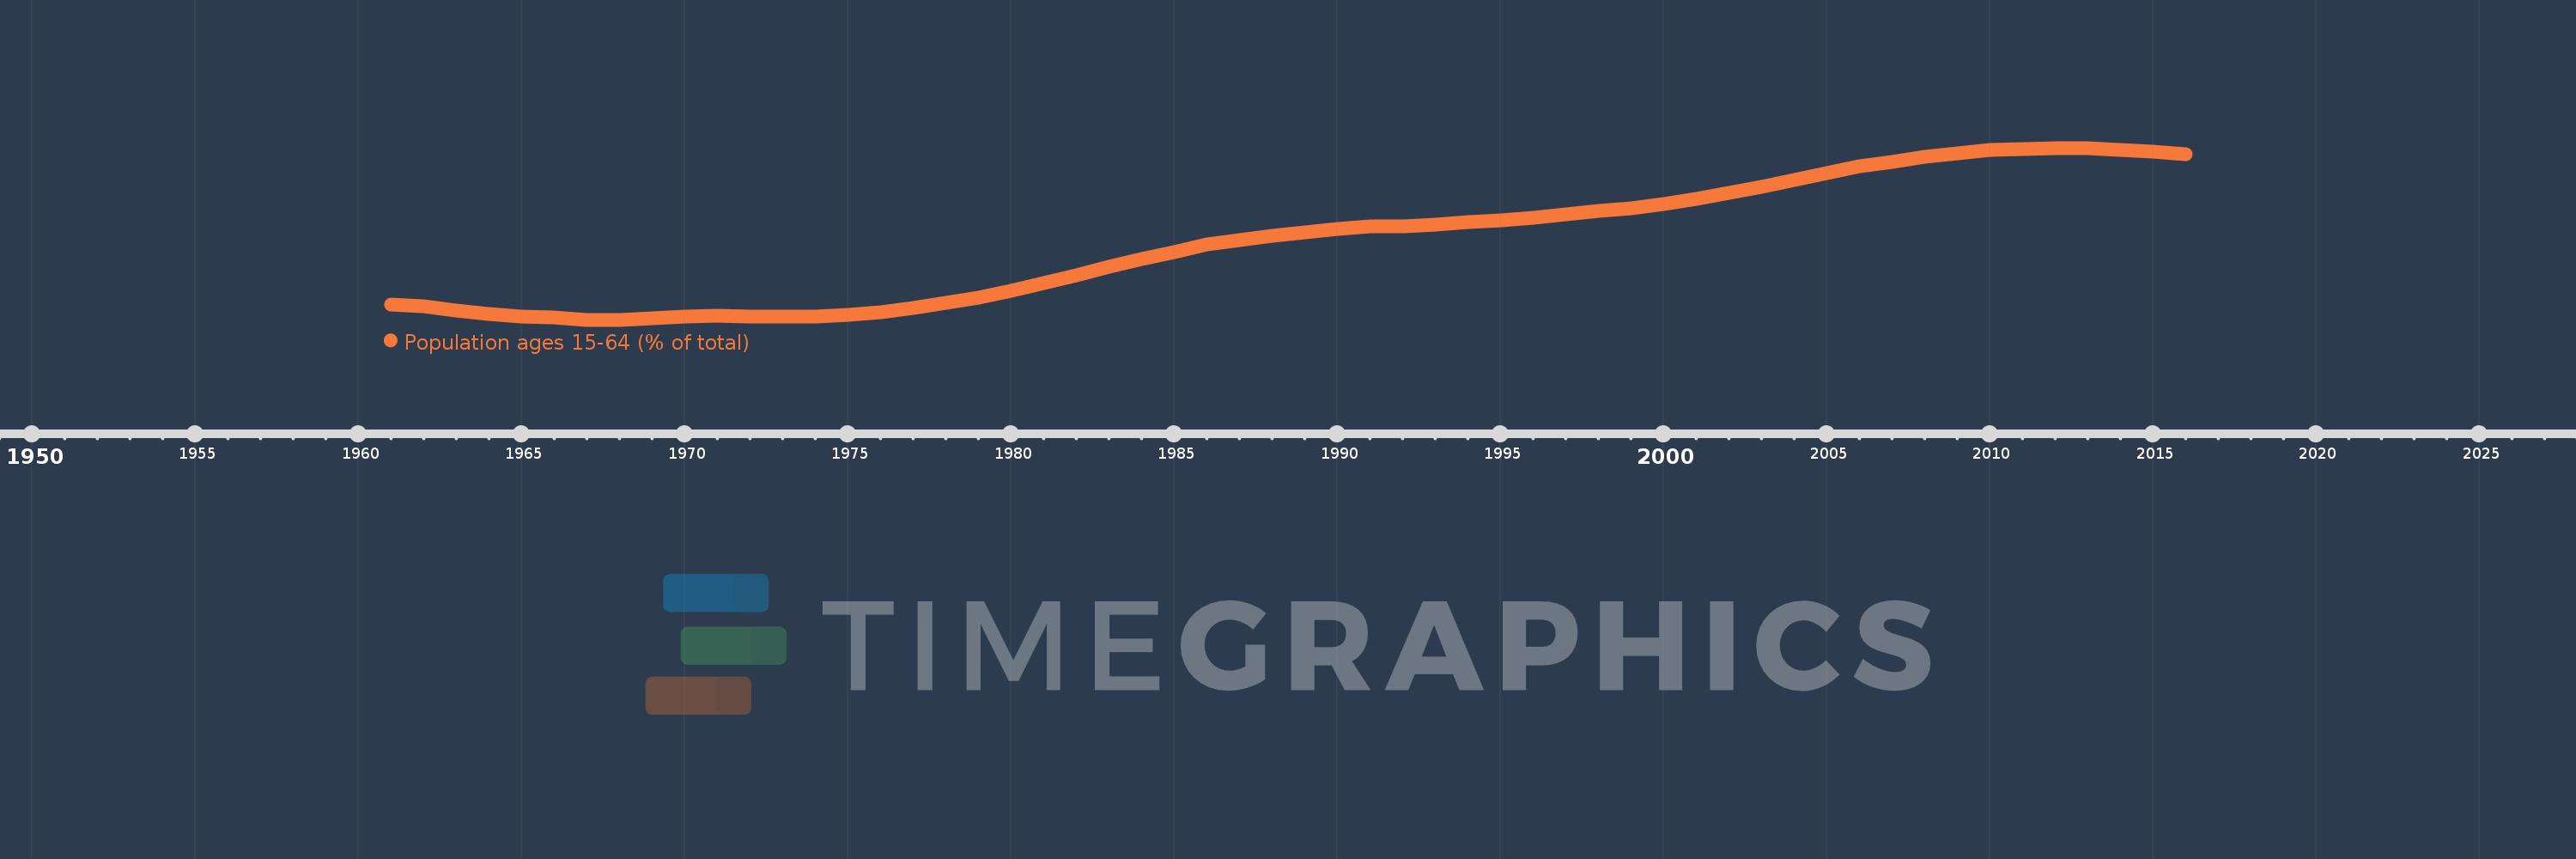
Population ages 15-64 (% of total)
2016,2015,2014,2013,2012,2011,2010,2009,2008,2007,2006,2005,2004,2003,2002,2001,2000,1999,1998,1997,1996,1995,1994,1993,1992,1991,1990,1989,1988,1987,1986,1985,1984,1983,1982,1981,1980,1979,1978,1977,1976,1975,1974,1973,1972,1971,1970,1969,1968,1967,1966,1965,1964,1963,1962,1961
Estas estatísticas em outros países:
AfghanistanAlbaniaAlgeriaAngolaAntigua and BarbudaArab WorldArgentinaArmeniaArubaAustraliaAustriaAzerbaijanBahamas, TheBahrainBangladeshBarbadosBelarusBelgiumBelizeBeninBhutanBoliviaBosnia and HerzegovinaBotswanaBrazilBrunei DarussalamBulgariaBurkina FasoBurundiCabo VerdeCambodiaCameroonCanadaCaribbean small statesCentral African RepublicCentral Europe and the BalticsChadChannel IslandsChileChinaColombiaComorosCongo, Dem. Rep.Congo, Rep.Costa RicaCote d'IvoireCroatiaCubaCuracaoCyprusCzech RepublicDenmarkDjiboutiDominican RepublicEarly-demographic dividendEast Asia & PacificEast Asia & Pacific (excluding high income)East Asia & Pacific (IDA & IBRD countries)EcuadorEgypt, Arab Rep.El SalvadorEquatorial GuineaEritreaEstoniaEthiopiaEuro areaEurope & Central AsiaEurope & Central Asia (excluding high income)Europe & Central Asia (IDA & IBRD countries)European UnionFijiFinlandFragile and conflict affected situationsFranceFrench PolynesiaGabonGambia, TheGeorgiaGermanyGhanaGreeceGrenadaGuamGuatemalaGuineaGuinea-BissauGuyanaHaitiHeavily indebted poor countries (HIPC)High incomeHondurasHong Kong SAR, ChinaHungaryIBRD onlyIcelandIDA & IBRD totalIDA blendIDA onlyIDA totalIndiaIndonesiaIran, Islamic Rep.IraqIrelandIsraelItalyJamaicaJapanJordanKazakhstanKenyaKiribatiKorea, Dem. People’s Rep.Korea, Rep.KosovoKuwaitKyrgyz RepublicLao PDRLate-demographic dividendLatin America & Caribbean Latin America & Caribbean (excluding high income)Latin America & the Caribbean (IDA & IBRD countries)LatviaLeast developed countries: UN classificationLebanonLesothoLiberiaLibyaLithuaniaLow & middle incomeLow incomeLower middle incomeLuxembourgMacao SAR, ChinaMacedonia, FYRMadagascarMalawiMalaysiaMaldivesMaliMaltaMauritaniaMauritiusMexicoMicronesia, Fed. Sts.Middle East & North AfricaMiddle East & North Africa (excluding high income)Middle East & North Africa (IDA & IBRD countries)Middle incomeMoldovaMongoliaMontenegroMoroccoMozambiqueMyanmarNamibiaNepalNetherlandsNew CaledoniaNew ZealandNicaraguaNigerNigeriaNorth AmericaNorwayOECD membersOmanOther small statesPacific island small statesPakistanPanamaPapua New GuineaParaguayPeruPhilippinesPolandPortugalPost-demographic dividendPre-demographic dividendPuerto RicoQatarRomaniaRussian FederationRwandaSamoaSao Tome and PrincipeSaudi ArabiaSenegalSerbiaSeychellesSierra LeoneSingaporeSlovak RepublicSloveniaSmall statesSolomon IslandsSomaliaSouth AfricaSouth AsiaSouth Asia (IDA & IBRD)South SudanSpainSri LankaSt. LuciaSt. Vincent and the GrenadinesSub-Saharan Africa Sub-Saharan Africa (excluding high income)Sub-Saharan Africa (IDA & IBRD countries)SudanSurinameSwazilandSwedenSwitzerlandSyrian Arab RepublicTajikistanTanzaniaThailandTimor-LesteTogoTongaTrinidad and TobagoTunisiaTurkeyTurkmenistanUgandaUkraineUnited Arab EmiratesUnited KingdomUnited StatesUpper middle incomeUruguayUzbekistanVanuatuVenezuela, RBVietnamVirgin Islands (U.S.)West Bank and GazaWorldYemen, Rep.ZambiaZimbabwe Linha do tempo:
Nesta escala de tempo está apresentado um gráfico de 1961 ano até 2016 ano East Asia & Pacific (excluding high income). Dados de 1960 ano ausente. O número de observações reais por data: 56.
Fonte (nome):
Indicadores de desenvolvimento mundial
Fonte (organização):
World Bank staff estimates based on age distributions of United Nations Population Division's World Population Prospects.
Categorias:
Education, Health
Foi atualizado:
23 abr 2017 ano
Indicadores de alterações dos valores ao longo dos anos
Mínimo:
54.502
1 jan 1968 ano
Máximo:
71.925
1 jan 2012 ano
Na data de observação
Valor
Mudança absoluta
A alteração em relação ao valor anterior
1 jan 1961 ano
56.036
+56.036
0.0%
1 jan 1962 ano
55.838
-0.198
-0.35%
1 jan 1963 ano
55.459
-0.379
-0.68%
1 jan 1964 ano
55.051
-0.408
-0.74%
1 jan 1965 ano
54.801
-0.249
-0.45%
1 jan 1966 ano
54.771
-0.03
-0.06%
1 jan 1967 ano
54.513
-0.258
-0.47%
1 jan 1968 ano
54.502
-0.011
-0.02%
1 jan 1969 ano
54.637
+0.135
0.25%
1 jan 1970 ano
54.781
+0.144
0.26%
1 jan 1971 ano
54.877
+0.096
0.18%
1 jan 1972 ano
54.806
-0.071
-0.13%
1 jan 1973 ano
54.802
-0.004
-0.01%
1 jan 1974 ano
54.859
+0.058
0.1%
1 jan 1975 ano
55.012
+0.153
0.28%
1 jan 1976 ano
55.29
+0.278
0.5%
1 jan 1977 ano
55.688
+0.399
0.72%
1 jan 1978 ano
56.183
+0.495
0.89%
1 jan 1979 ano
56.777
+0.594
1.06%
1 jan 1980 ano
57.458
+0.681
1.2%
1 jan 1981 ano
58.199
+0.741
1.29%
1 jan 1982 ano
59.04
+0.841
1.45%
1 jan 1983 ano
59.851
+0.81
1.37%
1 jan 1984 ano
60.639
+0.788
1.32%
1 jan 1985 ano
61.397
+0.758
1.25%
1 jan 1986 ano
62.099
+0.702
1.14%
1 jan 1987 ano
62.572
+0.474
0.76%
1 jan 1988 ano
62.998
+0.426
0.68%
1 jan 1989 ano
63.363
+0.365
0.58%
1 jan 1990 ano
63.677
+0.314
0.5%
1 jan 1991 ano
63.965
+0.288
0.45%
1 jan 1992 ano
63.997
+0.033
0.05%
1 jan 1993 ano
64.164
+0.167
0.26%
1 jan 1994 ano
64.395
+0.231
0.36%
1 jan 1995 ano
64.614
+0.219
0.34%
1 jan 1996 ano
64.805
+0.191
0.3%
1 jan 1997 ano
65.221
+0.416
0.64%
1 jan 1998 ano
65.529
+0.308
0.47%
1 jan 1999 ano
65.826
+0.297
0.45%
1 jan 2000 ano
66.236
+0.41
0.62%
1 jan 2001 ano
66.785
+0.55
0.83%
1 jan 2002 ano
67.349
+0.564
0.84%
1 jan 2003 ano
68.003
+0.654
0.97%
1 jan 2004 ano
68.713
+0.71
1.04%
1 jan 2005 ano
69.406
+0.693
1.01%
1 jan 2006 ano
70.037
+0.631
0.91%
1 jan 2007 ano
70.522
+0.485
0.69%
1 jan 2008 ano
70.988
+0.465
0.66%
1 jan 2009 ano
71.389
+0.402
0.57%
1 jan 2010 ano
71.682
+0.293
0.41%
1 jan 2011 ano
71.848
+0.166
0.23%
1 jan 2012 ano
71.925
+0.076
0.11%
1 jan 2013 ano
71.883
-0.042
-0.06%
1 jan 2014 ano
71.745
-0.137
-0.19%
1 jan 2015 ano
71.547
-0.198
-0.28%
1 jan 2016 ano
71.316
-0.231
-0.32%
Classificação de países por estatísticas atuais por anos


Comentários: