29
/pt/
pt
AIzaSyAYiBZKx7MnpbEhh9jyipgxe19OcubqV5w
April 1, 2024
256722
Sweden
SWE
true
2
1
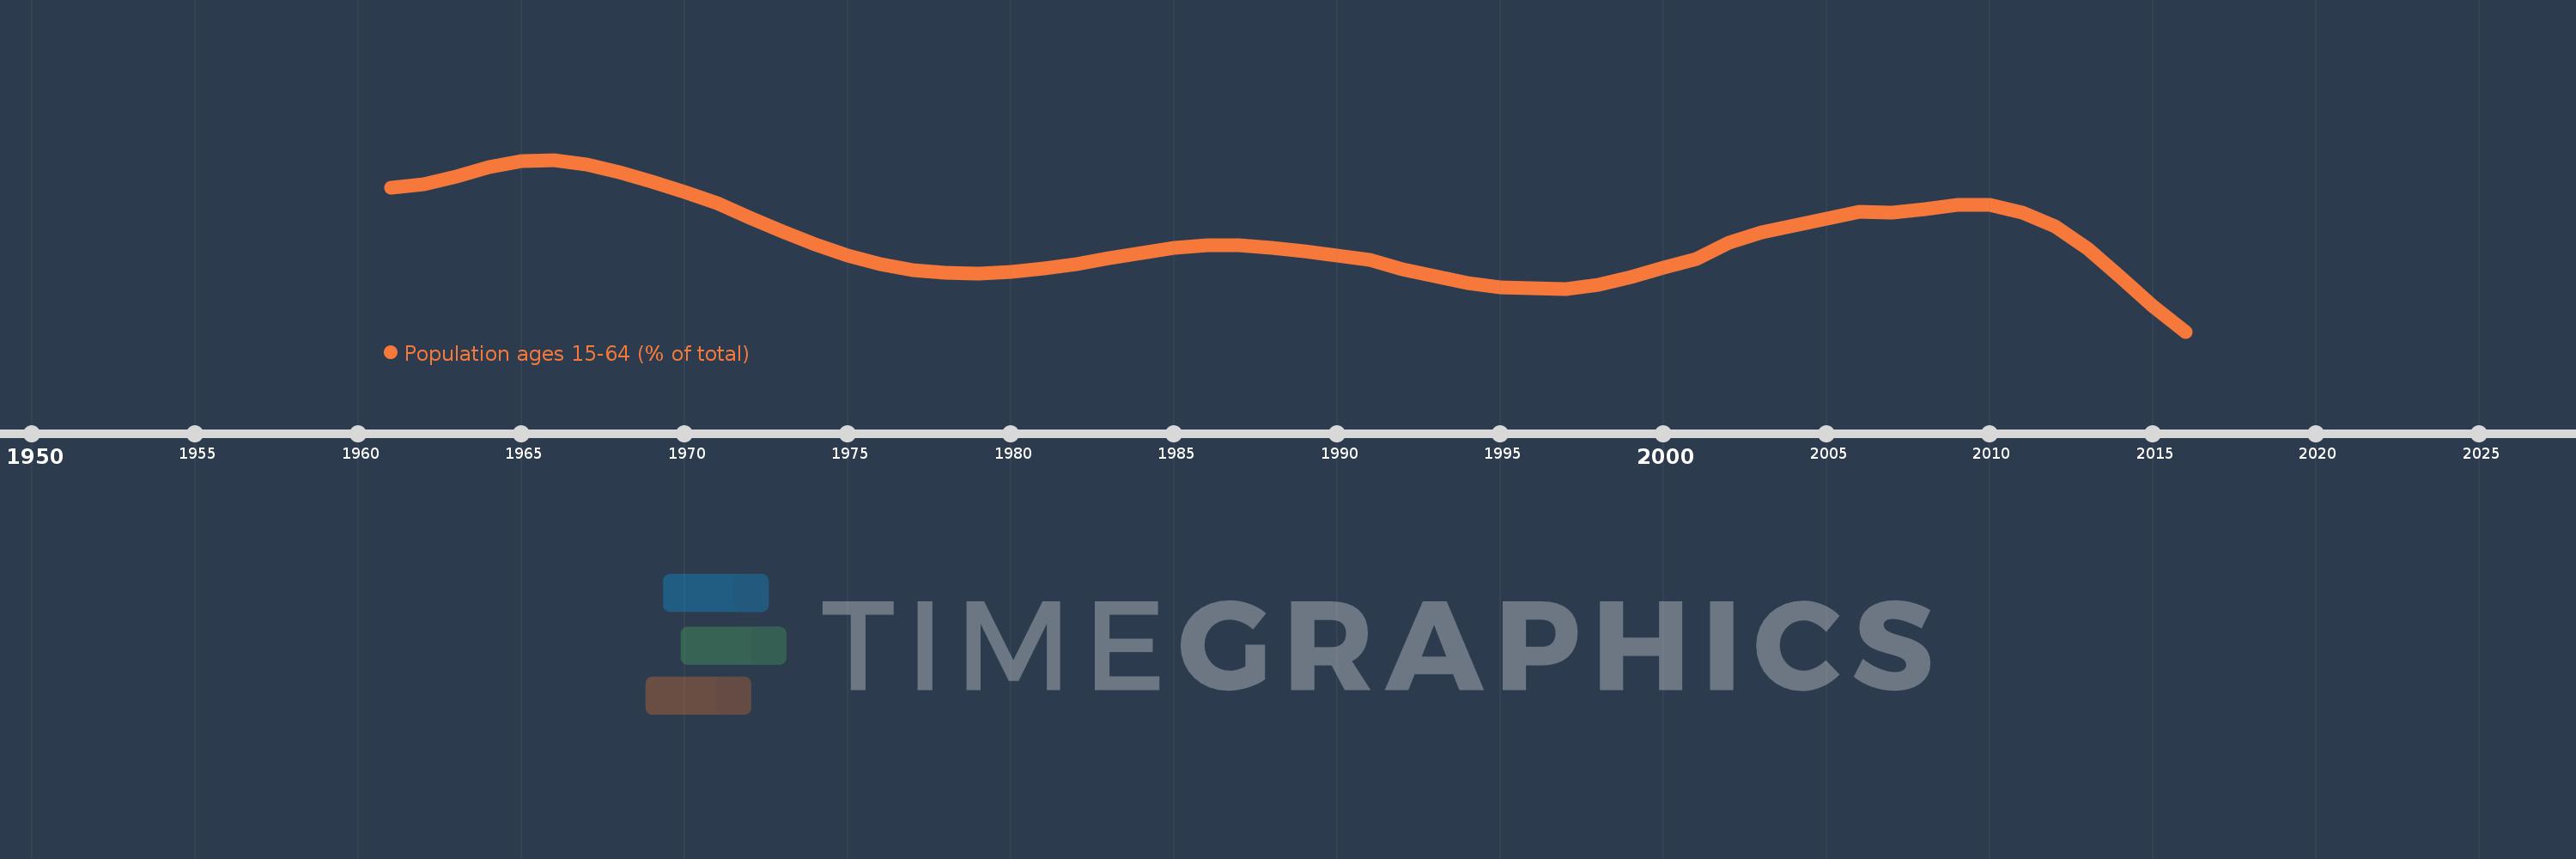
Population ages 15-64 (% of total)
2016,2015,2014,2013,2012,2011,2010,2009,2008,2007,2006,2005,2004,2003,2002,2001,2000,1999,1998,1997,1996,1995,1994,1993,1992,1991,1990,1989,1988,1987,1986,1985,1984,1983,1982,1981,1980,1979,1978,1977,1976,1975,1974,1973,1972,1971,1970,1969,1968,1967,1966,1965,1964,1963,1962,1961
Estas estatísticas em outros países:
AfghanistanAlbaniaAlgeriaAngolaAntigua and BarbudaArab WorldArgentinaArmeniaArubaAustraliaAustriaAzerbaijanBahamas, TheBahrainBangladeshBarbadosBelarusBelgiumBelizeBeninBhutanBoliviaBosnia and HerzegovinaBotswanaBrazilBrunei DarussalamBulgariaBurkina FasoBurundiCabo VerdeCambodiaCameroonCanadaCaribbean small statesCentral African RepublicCentral Europe and the BalticsChadChannel IslandsChileChinaColombiaComorosCongo, Dem. Rep.Congo, Rep.Costa RicaCote d'IvoireCroatiaCubaCuracaoCyprusCzech RepublicDenmarkDjiboutiDominican RepublicEarly-demographic dividendEast Asia & PacificEast Asia & Pacific (excluding high income)East Asia & Pacific (IDA & IBRD countries)EcuadorEgypt, Arab Rep.El SalvadorEquatorial GuineaEritreaEstoniaEthiopiaEuro areaEurope & Central AsiaEurope & Central Asia (excluding high income)Europe & Central Asia (IDA & IBRD countries)European UnionFijiFinlandFragile and conflict affected situationsFranceFrench PolynesiaGabonGambia, TheGeorgiaGermanyGhanaGreeceGrenadaGuamGuatemalaGuineaGuinea-BissauGuyanaHaitiHeavily indebted poor countries (HIPC)High incomeHondurasHong Kong SAR, ChinaHungaryIBRD onlyIcelandIDA & IBRD totalIDA blendIDA onlyIDA totalIndiaIndonesiaIran, Islamic Rep.IraqIrelandIsraelItalyJamaicaJapanJordanKazakhstanKenyaKiribatiKorea, Dem. People’s Rep.Korea, Rep.KosovoKuwaitKyrgyz RepublicLao PDRLate-demographic dividendLatin America & Caribbean Latin America & Caribbean (excluding high income)Latin America & the Caribbean (IDA & IBRD countries)LatviaLeast developed countries: UN classificationLebanonLesothoLiberiaLibyaLithuaniaLow & middle incomeLow incomeLower middle incomeLuxembourgMacao SAR, ChinaMacedonia, FYRMadagascarMalawiMalaysiaMaldivesMaliMaltaMauritaniaMauritiusMexicoMicronesia, Fed. Sts.Middle East & North AfricaMiddle East & North Africa (excluding high income)Middle East & North Africa (IDA & IBRD countries)Middle incomeMoldovaMongoliaMontenegroMoroccoMozambiqueMyanmarNamibiaNepalNetherlandsNew CaledoniaNew ZealandNicaraguaNigerNigeriaNorth AmericaNorwayOECD membersOmanOther small statesPacific island small statesPakistanPanamaPapua New GuineaParaguayPeruPhilippinesPolandPortugalPost-demographic dividendPre-demographic dividendPuerto RicoQatarRomaniaRussian FederationRwandaSamoaSao Tome and PrincipeSaudi ArabiaSenegalSerbiaSeychellesSierra LeoneSingaporeSlovak RepublicSloveniaSmall statesSolomon IslandsSomaliaSouth AfricaSouth AsiaSouth Asia (IDA & IBRD)South SudanSpainSri LankaSt. LuciaSt. Vincent and the GrenadinesSub-Saharan Africa Sub-Saharan Africa (excluding high income)Sub-Saharan Africa (IDA & IBRD countries)SudanSurinameSwazilandSwedenSwitzerlandSyrian Arab RepublicTajikistanTanzaniaThailandTimor-LesteTogoTongaTrinidad and TobagoTunisiaTurkeyTurkmenistanUgandaUkraineUnited Arab EmiratesUnited KingdomUnited StatesUpper middle incomeUruguayUzbekistanVanuatuVenezuela, RBVietnamVirgin Islands (U.S.)West Bank and GazaWorldYemen, Rep.ZambiaZimbabwe Linha do tempo:
Nesta escala de tempo está apresentado um gráfico de 1961 ano até 2016 ano Sweden. Dados de 1960 ano ausente. O número de observações reais por data: 56.
Fonte (nome):
Indicadores de desenvolvimento mundial
Fonte (organização):
World Bank staff estimates based on age distributions of United Nations Population Division's World Population Prospects.
Categorias:
Education, Health
Foi atualizado:
23 abr 2017 ano
Indicadores de alterações dos valores ao longo dos anos
Mínimo:
62.773
1 jan 2016 ano
Máximo:
66.403
1 jan 1966 ano
Na data de observação
Valor
Mudança absoluta
A alteração em relação ao valor anterior
1 jan 1961 ano
65.816
+65.816
0.0%
1 jan 1962 ano
65.894
+0.077
0.12%
1 jan 1963 ano
66.056
+0.162
0.25%
1 jan 1964 ano
66.242
+0.186
0.28%
1 jan 1965 ano
66.371
+0.129
0.2%
1 jan 1966 ano
66.403
+0.031
0.05%
1 jan 1967 ano
66.3
-0.103
-0.15%
1 jan 1968 ano
66.146
-0.154
-0.23%
1 jan 1969 ano
65.941
-0.206
-0.31%
1 jan 1970 ano
65.714
-0.227
-0.34%
1 jan 1971 ano
65.494
-0.22
-0.33%
1 jan 1972 ano
65.183
-0.311
-0.47%
1 jan 1973 ano
64.883
-0.3
-0.46%
1 jan 1974 ano
64.609
-0.274
-0.42%
1 jan 1975 ano
64.377
-0.232
-0.36%
1 jan 1976 ano
64.196
-0.181
-0.28%
1 jan 1977 ano
64.071
-0.125
-0.19%
1 jan 1978 ano
64.01
-0.061
-0.09%
1 jan 1979 ano
64.003
-0.007
-0.01%
1 jan 1980 ano
64.04
+0.037
0.06%
1 jan 1981 ano
64.115
+0.075
0.12%
1 jan 1982 ano
64.206
+0.091
0.14%
1 jan 1983 ano
64.316
+0.111
0.17%
1 jan 1984 ano
64.436
+0.12
0.19%
1 jan 1985 ano
64.539
+0.103
0.16%
1 jan 1986 ano
64.6
+0.061
0.09%
1 jan 1987 ano
64.593
-0.007
-0.01%
1 jan 1988 ano
64.547
-0.046
-0.07%
1 jan 1989 ano
64.469
-0.079
-0.12%
1 jan 1990 ano
64.376
-0.093
-0.14%
1 jan 1991 ano
64.283
-0.093
-0.14%
1 jan 1992 ano
64.095
-0.188
-0.29%
1 jan 1993 ano
63.937
-0.158
-0.25%
1 jan 1994 ano
63.804
-0.133
-0.21%
1 jan 1995 ano
63.711
-0.092
-0.14%
1 jan 1996 ano
63.685
-0.026
-0.04%
1 jan 1997 ano
63.666
-0.019
-0.03%
1 jan 1998 ano
63.758
+0.092
0.14%
1 jan 1999 ano
63.93
+0.172
0.27%
1 jan 2000 ano
64.125
+0.195
0.31%
1 jan 2001 ano
64.304
+0.179
0.28%
1 jan 2002 ano
64.645
+0.34
0.53%
1 jan 2003 ano
64.862
+0.217
0.34%
1 jan 2004 ano
65.007
+0.145
0.22%
1 jan 2005 ano
65.151
+0.145
0.22%
1 jan 2006 ano
65.313
+0.162
0.25%
1 jan 2007 ano
65.289
-0.025
-0.04%
1 jan 2008 ano
65.36
+0.071
0.11%
1 jan 2009 ano
65.456
+0.096
0.15%
1 jan 2010 ano
65.455
-0.001
0.0%
1 jan 2011 ano
65.29
-0.166
-0.25%
1 jan 2012 ano
64.998
-0.291
-0.45%
1 jan 2013 ano
64.53
-0.469
-0.72%
1 jan 2014 ano
63.924
-0.606
-0.94%
1 jan 2015 ano
63.304
-0.619
-0.97%
1 jan 2016 ano
62.773
-0.531
-0.84%
Classificação de países por estatísticas atuais por anos


Comentários: