29
/pt/
pt
AIzaSyAYiBZKx7MnpbEhh9jyipgxe19OcubqV5w
April 1, 2024
72473
Aruba
ABW
true
2
1
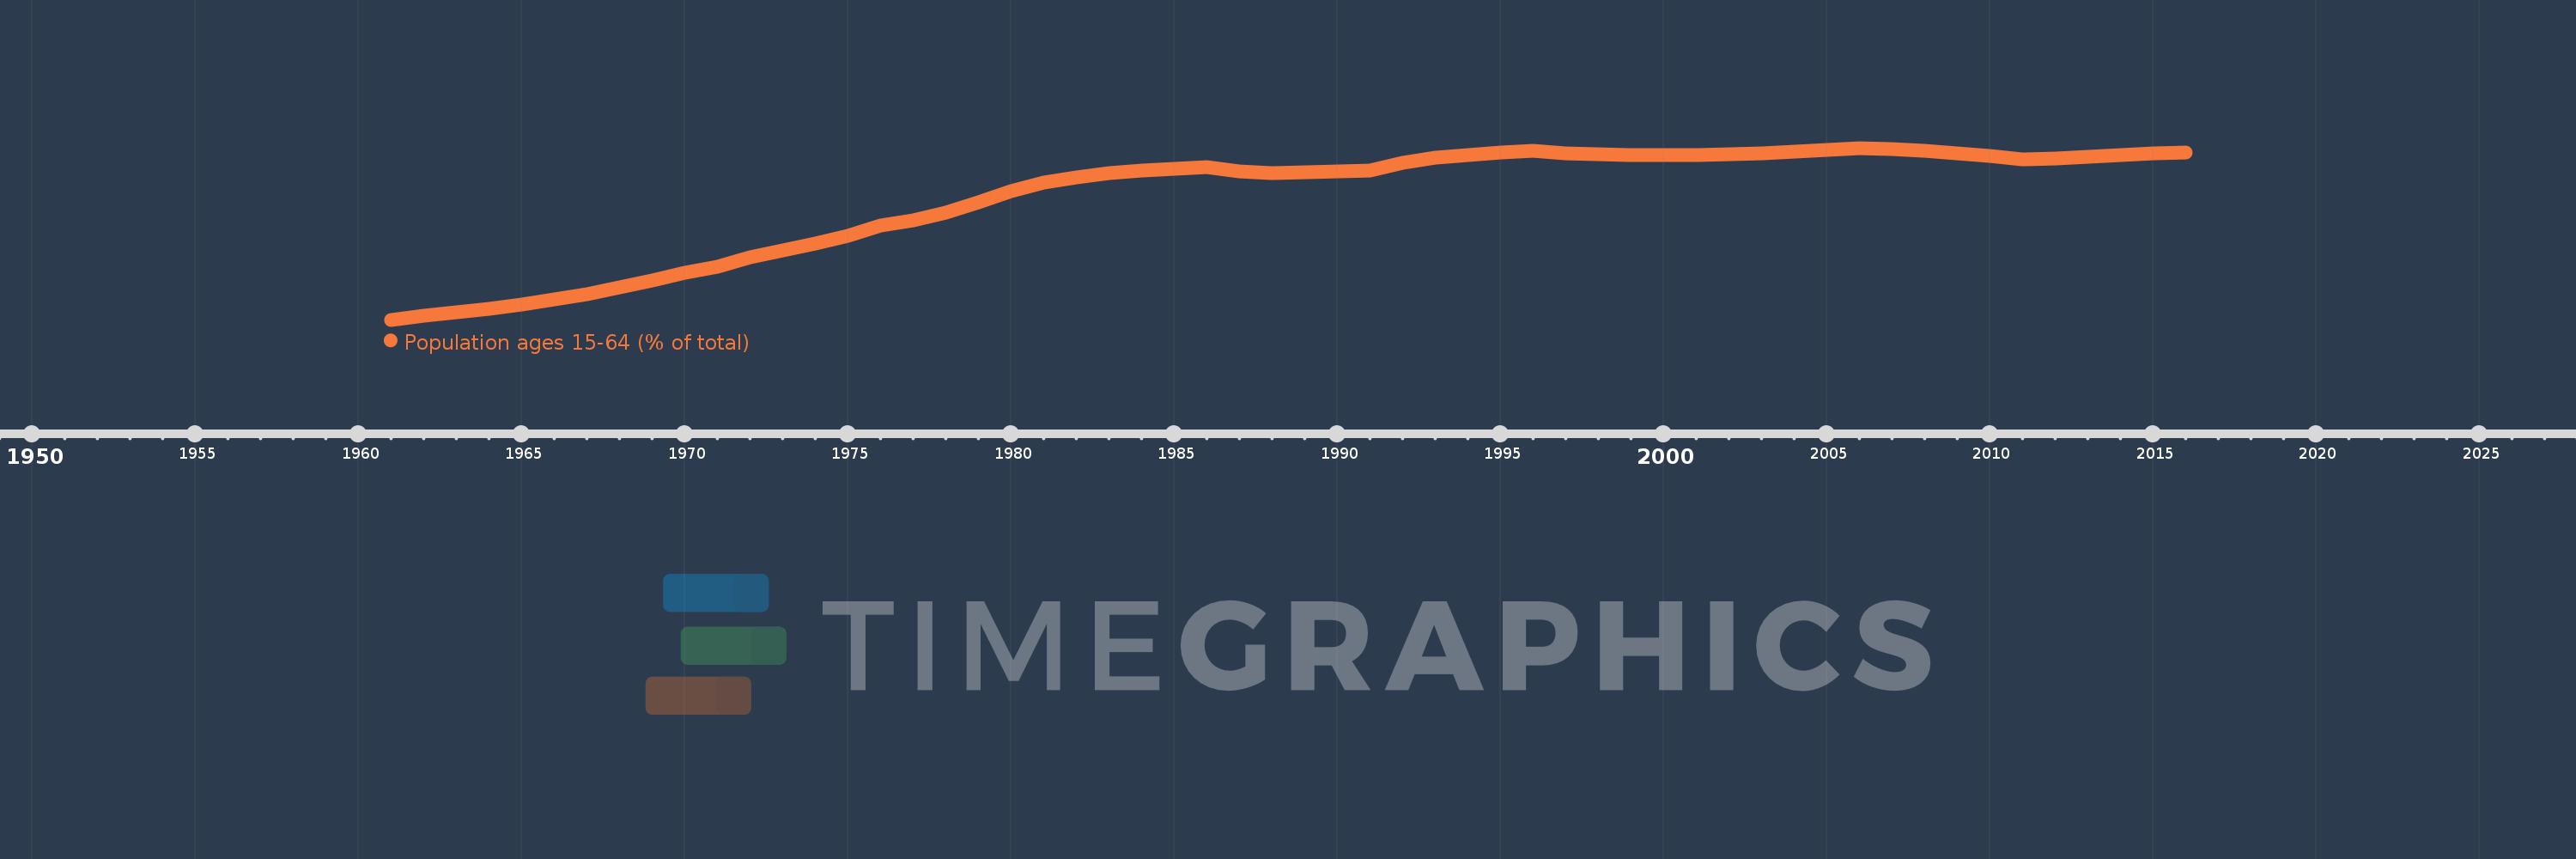
Population ages 15-64 (% of total)
2016,2015,2014,2013,2012,2011,2010,2009,2008,2007,2006,2005,2004,2003,2002,2001,2000,1999,1998,1997,1996,1995,1994,1993,1992,1991,1990,1989,1988,1987,1986,1985,1984,1983,1982,1981,1980,1979,1978,1977,1976,1975,1974,1973,1972,1971,1970,1969,1968,1967,1966,1965,1964,1963,1962,1961
Estas estatísticas em outros países:
AfghanistanAlbaniaAlgeriaAngolaAntigua and BarbudaArab WorldArgentinaArmeniaArubaAustraliaAustriaAzerbaijanBahamas, TheBahrainBangladeshBarbadosBelarusBelgiumBelizeBeninBhutanBoliviaBosnia and HerzegovinaBotswanaBrazilBrunei DarussalamBulgariaBurkina FasoBurundiCabo VerdeCambodiaCameroonCanadaCaribbean small statesCentral African RepublicCentral Europe and the BalticsChadChannel IslandsChileChinaColombiaComorosCongo, Dem. Rep.Congo, Rep.Costa RicaCote d'IvoireCroatiaCubaCuracaoCyprusCzech RepublicDenmarkDjiboutiDominican RepublicEarly-demographic dividendEast Asia & PacificEast Asia & Pacific (excluding high income)East Asia & Pacific (IDA & IBRD countries)EcuadorEgypt, Arab Rep.El SalvadorEquatorial GuineaEritreaEstoniaEthiopiaEuro areaEurope & Central AsiaEurope & Central Asia (excluding high income)Europe & Central Asia (IDA & IBRD countries)European UnionFijiFinlandFragile and conflict affected situationsFranceFrench PolynesiaGabonGambia, TheGeorgiaGermanyGhanaGreeceGrenadaGuamGuatemalaGuineaGuinea-BissauGuyanaHaitiHeavily indebted poor countries (HIPC)High incomeHondurasHong Kong SAR, ChinaHungaryIBRD onlyIcelandIDA & IBRD totalIDA blendIDA onlyIDA totalIndiaIndonesiaIran, Islamic Rep.IraqIrelandIsraelItalyJamaicaJapanJordanKazakhstanKenyaKiribatiKorea, Dem. People’s Rep.Korea, Rep.KosovoKuwaitKyrgyz RepublicLao PDRLate-demographic dividendLatin America & Caribbean Latin America & Caribbean (excluding high income)Latin America & the Caribbean (IDA & IBRD countries)LatviaLeast developed countries: UN classificationLebanonLesothoLiberiaLibyaLithuaniaLow & middle incomeLow incomeLower middle incomeLuxembourgMacao SAR, ChinaMacedonia, FYRMadagascarMalawiMalaysiaMaldivesMaliMaltaMauritaniaMauritiusMexicoMicronesia, Fed. Sts.Middle East & North AfricaMiddle East & North Africa (excluding high income)Middle East & North Africa (IDA & IBRD countries)Middle incomeMoldovaMongoliaMontenegroMoroccoMozambiqueMyanmarNamibiaNepalNetherlandsNew CaledoniaNew ZealandNicaraguaNigerNigeriaNorth AmericaNorwayOECD membersOmanOther small statesPacific island small statesPakistanPanamaPapua New GuineaParaguayPeruPhilippinesPolandPortugalPost-demographic dividendPre-demographic dividendPuerto RicoQatarRomaniaRussian FederationRwandaSamoaSao Tome and PrincipeSaudi ArabiaSenegalSerbiaSeychellesSierra LeoneSingaporeSlovak RepublicSloveniaSmall statesSolomon IslandsSomaliaSouth AfricaSouth AsiaSouth Asia (IDA & IBRD)South SudanSpainSri LankaSt. LuciaSt. Vincent and the GrenadinesSub-Saharan Africa Sub-Saharan Africa (excluding high income)Sub-Saharan Africa (IDA & IBRD countries)SudanSurinameSwazilandSwedenSwitzerlandSyrian Arab RepublicTajikistanTanzaniaThailandTimor-LesteTogoTongaTrinidad and TobagoTunisiaTurkeyTurkmenistanUgandaUkraineUnited Arab EmiratesUnited KingdomUnited StatesUpper middle incomeUruguayUzbekistanVanuatuVenezuela, RBVietnamVirgin Islands (U.S.)West Bank and GazaWorldYemen, Rep.ZambiaZimbabwe Linha do tempo:
Nesta escala de tempo está apresentado um gráfico de 1961 ano até 2016 ano Aruba. Dados de 1960 ano ausente. O número de observações reais por data: 56.
Fonte (nome):
Indicadores de desenvolvimento mundial
Fonte (organização):
World Bank staff estimates based on age distributions of United Nations Population Division's World Population Prospects.
Categorias:
Education, Health
Foi atualizado:
23 abr 2017 ano
Indicadores de alterações dos valores ao longo dos anos
Mínimo:
53.667
1 jan 1961 ano
Máximo:
69.938
1 jan 2006 ano
Na data de observação
Valor
Mudança absoluta
A alteração em relação ao valor anterior
1 jan 1961 ano
53.667
+53.667
0.0%
1 jan 1962 ano
54.056
+0.389
0.72%
1 jan 1963 ano
54.384
+0.328
0.61%
1 jan 1964 ano
54.708
+0.324
0.6%
1 jan 1965 ano
55.114
+0.406
0.74%
1 jan 1966 ano
55.631
+0.517
0.94%
1 jan 1967 ano
56.078
+0.447
0.8%
1 jan 1968 ano
56.702
+0.624
1.11%
1 jan 1969 ano
57.415
+0.713
1.26%
1 jan 1970 ano
58.09
+0.675
1.18%
1 jan 1971 ano
58.674
+0.584
1.01%
1 jan 1972 ano
59.546
+0.872
1.49%
1 jan 1973 ano
60.248
+0.702
1.18%
1 jan 1974 ano
60.891
+0.642
1.07%
1 jan 1975 ano
61.644
+0.753
1.24%
1 jan 1976 ano
62.569
+0.925
1.5%
1 jan 1977 ano
63.077
+0.509
0.81%
1 jan 1978 ano
63.851
+0.773
1.23%
1 jan 1979 ano
64.825
+0.975
1.53%
1 jan 1980 ano
65.809
+0.984
1.52%
1 jan 1981 ano
66.635
+0.826
1.26%
1 jan 1982 ano
67.185
+0.55
0.83%
1 jan 1983 ano
67.584
+0.399
0.59%
1 jan 1984 ano
67.801
+0.217
0.32%
1 jan 1985 ano
67.952
+0.151
0.22%
1 jan 1986 ano
68.154
+0.202
0.3%
1 jan 1987 ano
67.756
-0.398
-0.58%
1 jan 1988 ano
67.573
-0.183
-0.27%
1 jan 1989 ano
67.618
+0.045
0.07%
1 jan 1990 ano
67.751
+0.133
0.2%
1 jan 1991 ano
67.796
+0.045
0.07%
1 jan 1992 ano
68.516
+0.72
1.06%
1 jan 1993 ano
69.022
+0.506
0.74%
1 jan 1994 ano
69.3
+0.278
0.4%
1 jan 1995 ano
69.477
+0.177
0.26%
1 jan 1996 ano
69.67
+0.193
0.28%
1 jan 1997 ano
69.452
-0.217
-0.31%
1 jan 1998 ano
69.326
-0.126
-0.18%
1 jan 1999 ano
69.284
-0.042
-0.06%
1 jan 2000 ano
69.262
-0.022
-0.03%
1 jan 2001 ano
69.242
-0.02
-0.03%
1 jan 2002 ano
69.326
+0.084
0.12%
1 jan 2003 ano
69.42
+0.094
0.14%
1 jan 2004 ano
69.554
+0.134
0.19%
1 jan 2005 ano
69.732
+0.178
0.26%
1 jan 2006 ano
69.938
+0.206
0.3%
1 jan 2007 ano
69.861
-0.077
-0.11%
1 jan 2008 ano
69.698
-0.163
-0.23%
1 jan 2009 ano
69.465
-0.233
-0.33%
1 jan 2010 ano
69.189
-0.276
-0.4%
1 jan 2011 ano
68.891
-0.298
-0.43%
1 jan 2012 ano
68.969
+0.078
0.11%
1 jan 2013 ano
69.105
+0.137
0.2%
1 jan 2014 ano
69.274
+0.168
0.24%
1 jan 2015 ano
69.411
+0.137
0.2%
1 jan 2016 ano
69.467
+0.057
0.08%
Classificação de países por estatísticas atuais por anos


Comentários: