29
/pt/
pt
AIzaSyAYiBZKx7MnpbEhh9jyipgxe19OcubqV5w
April 1, 2024
74270
Austria
AUT
true
2
1
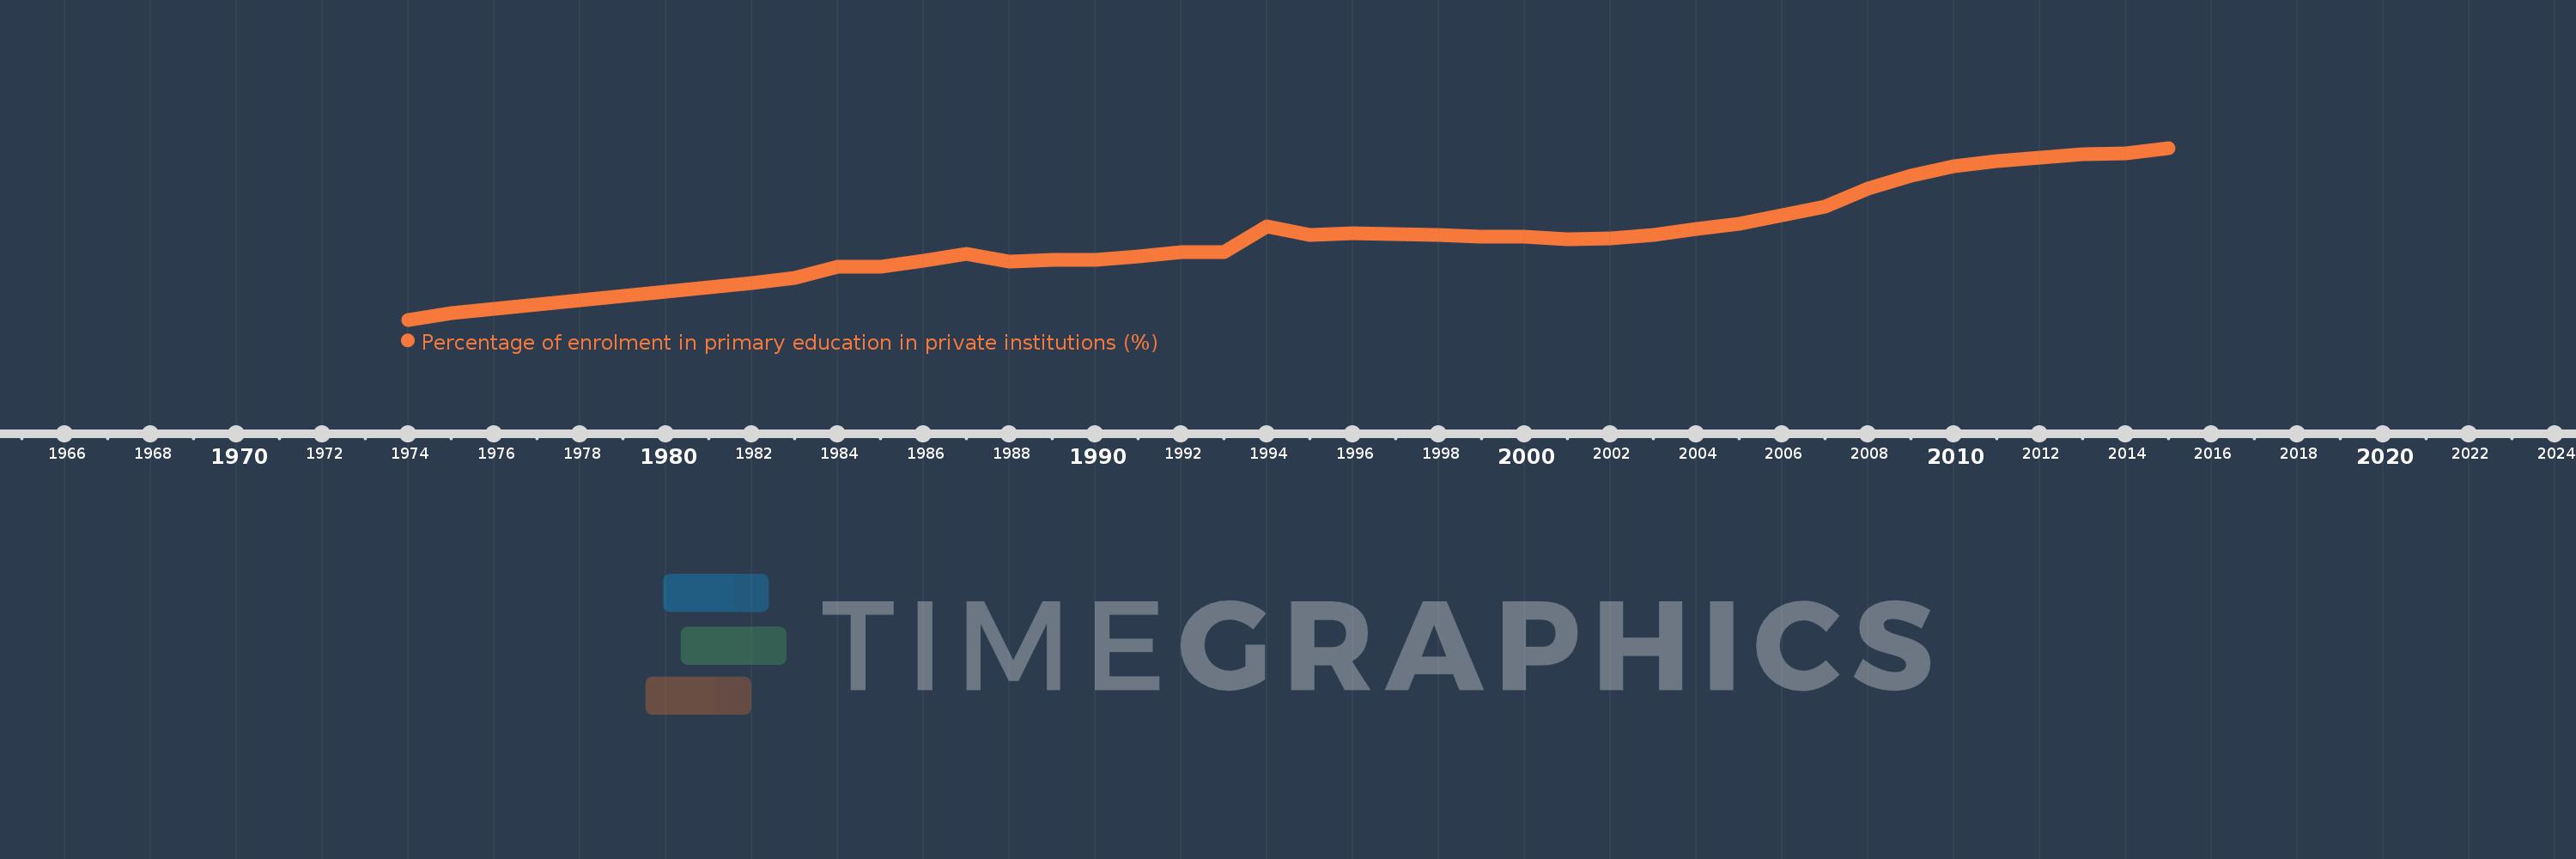
Percentage of enrolment in primary education in private institutions (%)
2015,2014,2013,2012,2011,2010,2009,2008,2007,2006,2005,2004,2003,2002,2001,2000,1999,1998,1997,1996,1995,1994,1993,1992,1991,1990,1989,1988,1987,1986,1985,1984,1983,1982,1976,1975,1974
Estas estatísticas em outros países:
AfghanistanAlbaniaAlgeriaAndorraAngolaAntigua and BarbudaArab WorldArgentinaArmeniaArubaAustraliaAustriaAzerbaijanBahamas, TheBahrainBangladeshBarbadosBelarusBelgiumBelizeBeninBermudaBhutanBoliviaBosnia and HerzegovinaBotswanaBrazilBritish Virgin IslandsBrunei DarussalamBulgariaBurkina FasoBurundiCabo VerdeCambodiaCameroonCanadaCaribbean small statesCayman IslandsCentral African RepublicCentral Europe and the BalticsChadChileChinaColombiaComorosCongo, Dem. Rep.Congo, Rep.Costa RicaCote d'IvoireCroatiaCubaCuracaoCyprusCzech RepublicDenmarkDjiboutiDominicaDominican RepublicEarly-demographic dividendEast Asia & PacificEast Asia & Pacific (excluding high income)East Asia & Pacific (IDA & IBRD countries)EcuadorEgypt, Arab Rep.El SalvadorEquatorial GuineaEritreaEstoniaEthiopiaEuro areaEurope & Central AsiaEurope & Central Asia (excluding high income)Europe & Central Asia (IDA & IBRD countries)European UnionFijiFinlandFragile and conflict affected situationsFranceGabonGambia, TheGeorgiaGermanyGhanaGibraltarGreeceGrenadaGuatemalaGuineaGuinea-BissauGuyanaHaitiHeavily indebted poor countries (HIPC)High incomeHondurasHong Kong SAR, ChinaHungaryIBRD onlyIcelandIDA & IBRD totalIDA blendIDA onlyIDA totalIndiaIndonesiaIran, Islamic Rep.IraqIrelandIsraelItalyJamaicaJapanJordanKazakhstanKenyaKiribatiKorea, Rep.KuwaitKyrgyz RepublicLao PDRLate-demographic dividendLatin America & Caribbean Latin America & Caribbean (excluding high income)Latin America & the Caribbean (IDA & IBRD countries)LatviaLeast developed countries: UN classificationLebanonLesothoLiberiaLibyaLiechtensteinLithuaniaLow & middle incomeLow incomeLower middle incomeLuxembourgMacao SAR, ChinaMacedonia, FYRMadagascarMalawiMalaysiaMaldivesMaliMaltaMarshall IslandsMauritaniaMauritiusMexicoMiddle East & North AfricaMiddle East & North Africa (excluding high income)Middle East & North Africa (IDA & IBRD countries)Middle incomeMoldovaMonacoMongoliaMoroccoMozambiqueMyanmarNamibiaNauruNepalNetherlandsNew ZealandNicaraguaNigerNigeriaNorth AmericaNorwayOECD membersOmanOther small statesPacific island small statesPakistanPalauPanamaPapua New GuineaParaguayPeruPhilippinesPolandPortugalPost-demographic dividendPre-demographic dividendPuerto RicoQatarRomaniaRussian FederationRwandaSamoaSan MarinoSao Tome and PrincipeSaudi ArabiaSenegalSerbiaSeychellesSierra LeoneSingaporeSlovak RepublicSloveniaSmall statesSolomon IslandsSomaliaSouth AfricaSouth AsiaSouth Asia (IDA & IBRD)SpainSri LankaSt. Kitts and NevisSt. LuciaSt. Vincent and the GrenadinesSub-Saharan Africa Sub-Saharan Africa (excluding high income)Sub-Saharan Africa (IDA & IBRD countries)SudanSurinameSwazilandSwedenSwitzerlandSyrian Arab RepublicTajikistanTanzaniaThailandTimor-LesteTogoTongaTrinidad and TobagoTunisiaTurkeyTurks and Caicos IslandsTuvaluUgandaUkraineUnited Arab EmiratesUnited KingdomUnited StatesUpper middle incomeUruguayVanuatuVenezuela, RBVietnamWest Bank and GazaWorldYemen, Rep.ZambiaZimbabwe Linha do tempo:
Nesta escala de tempo está apresentado um gráfico de 1974 ano até 2015 ano Austria. Dados de 1973 ano ausente. O número de observações reais por data: 37.
Fonte (nome):
Indicadores de desenvolvimento mundial
Fonte (organização):
UNESCO Institute for Statistics
Categorias:
Education
Foi atualizado:
23 abr 2017 ano
Indicadores de alterações dos valores ao longo dos anos
Mínimo:
2.662
1 jan 1974 ano
Máximo:
5.992
1 jan 2015 ano
Na data de observação
Valor
Mudança absoluta
A alteração em relação ao valor anterior
1 jan 1974 ano
2.662
+2.662
0.0%
1 jan 1975 ano
2.784
+0.121
4.55%
1 jan 1976 ano
2.879
+0.095
3.43%
1 jan 1982 ano
3.365
+0.486
16.9%
1 jan 1983 ano
3.479
+0.113
3.37%
1 jan 1984 ano
3.682
+0.203
5.84%
1 jan 1985 ano
3.695
+0.013
0.35%
1 jan 1986 ano
3.814
+0.119
3.22%
1 jan 1987 ano
3.938
+0.125
3.27%
1 jan 1988 ano
3.794
-0.145
-3.67%
1 jan 1989 ano
3.818
+0.024
0.63%
1 jan 1990 ano
3.83
+0.012
0.31%
1 jan 1991 ano
3.893
+0.063
1.65%
1 jan 1992 ano
3.965
+0.072
1.86%
1 jan 1993 ano
3.965
+0.0
0.0%
1 jan 1994 ano
4.477
+0.512
12.91%
1 jan 1995 ano
4.299
-0.178
-3.97%
1 jan 1996 ano
4.332
+0.032
0.75%
1 jan 1997 ano
4.32
-0.012
-0.27%
1 jan 1998 ano
4.304
-0.016
-0.36%
1 jan 1999 ano
4.272
-0.032
-0.75%
1 jan 2000 ano
4.264
-0.009
-0.21%
1 jan 2001 ano
4.226
-0.038
-0.88%
1 jan 2002 ano
4.242
+0.016
0.38%
1 jan 2003 ano
4.308
+0.066
1.55%
1 jan 2004 ano
4.416
+0.109
2.52%
1 jan 2005 ano
4.53
+0.114
2.59%
1 jan 2006 ano
4.68
+0.15
3.31%
1 jan 2007 ano
4.858
+0.177
3.79%
1 jan 2008 ano
5.209
+0.351
7.23%
1 jan 2009 ano
5.449
+0.24
4.61%
1 jan 2010 ano
5.633
+0.184
3.37%
1 jan 2011 ano
5.74
+0.107
1.91%
1 jan 2012 ano
5.809
+0.069
1.2%
1 jan 2013 ano
5.876
+0.067
1.15%
1 jan 2014 ano
5.885
+0.009
0.14%
1 jan 2015 ano
5.992
+0.107
1.82%
Classificação de países por estatísticas atuais por anos


Comentários: