29
/pt/
pt
AIzaSyAYiBZKx7MnpbEhh9jyipgxe19OcubqV5w
April 1, 2024
55778
Pre-demographic dividend
PRE
false
2
1
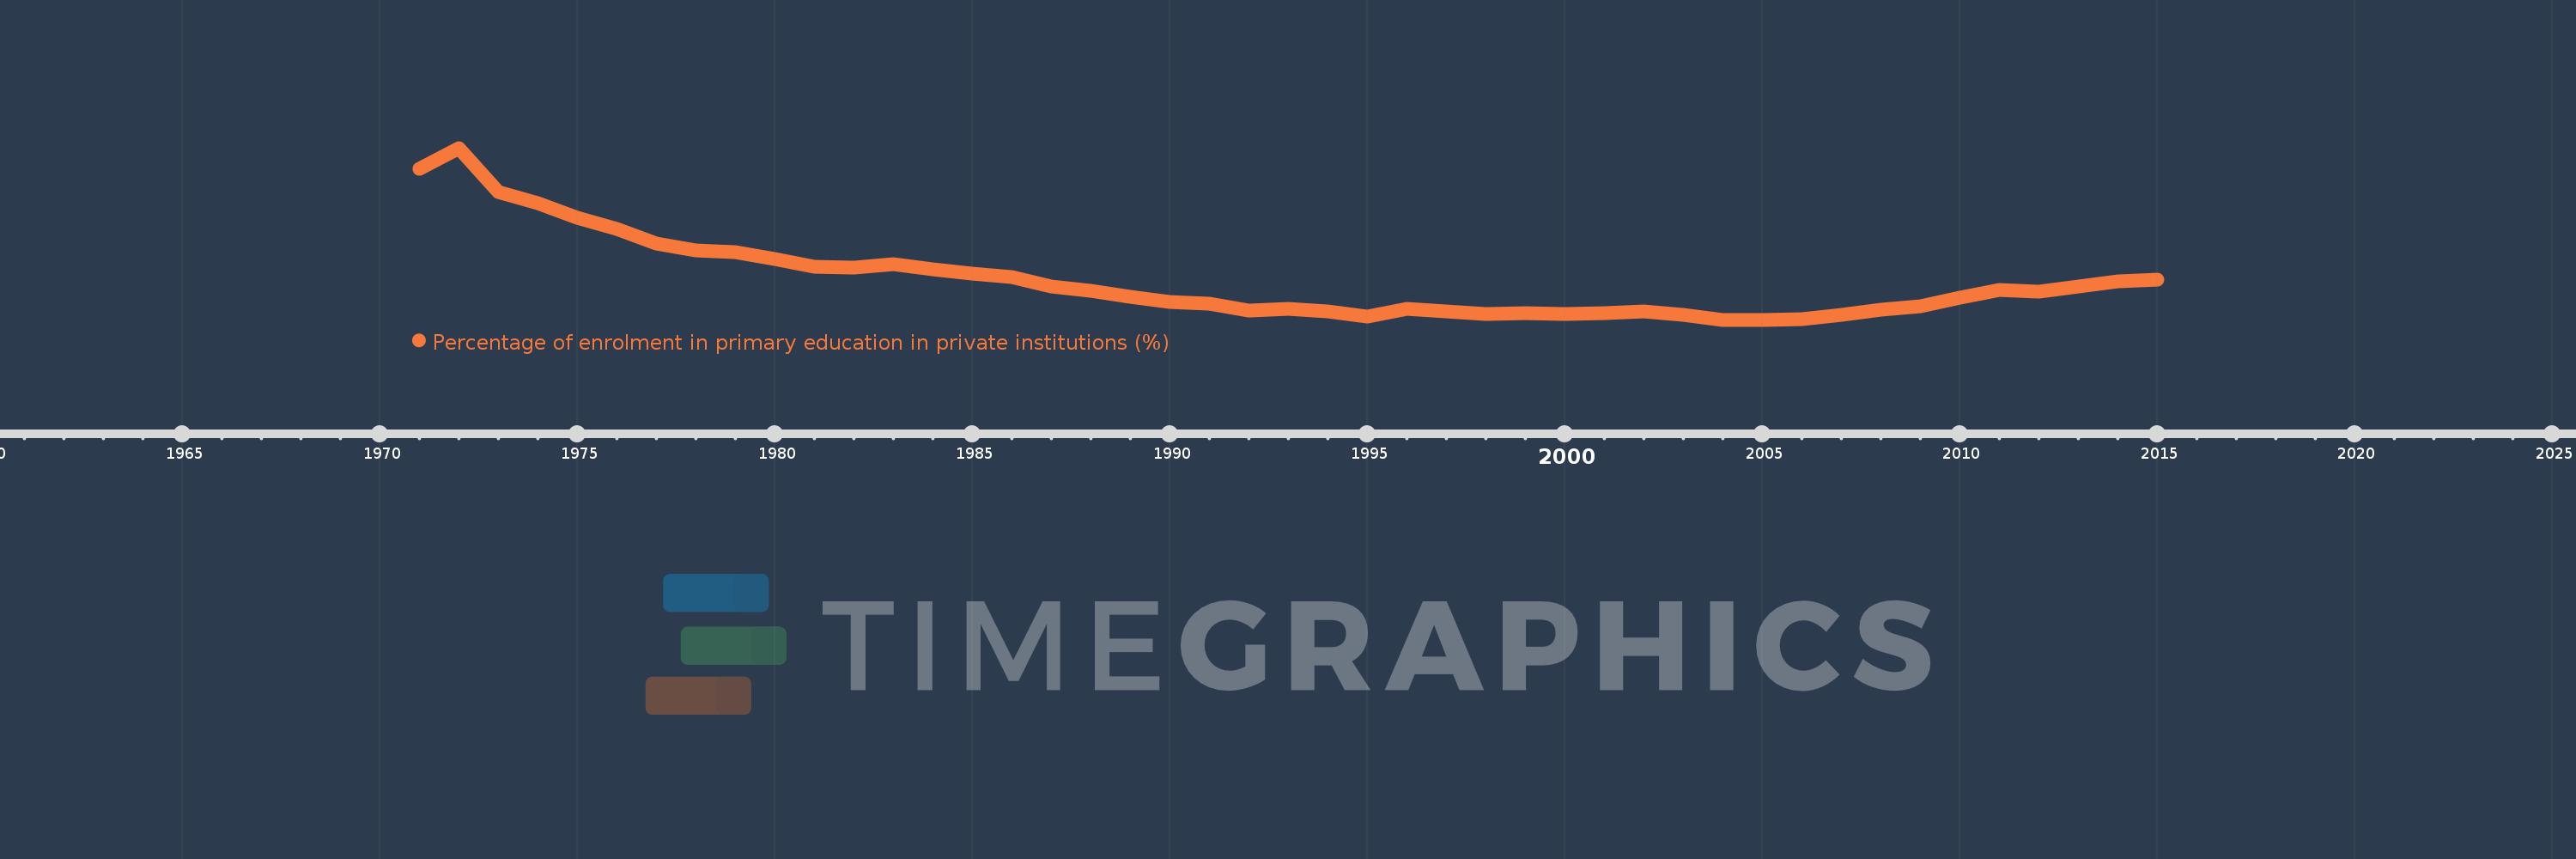
Percentage of enrolment in primary education in private institutions (%)
2015,2014,2013,2012,2011,2010,2009,2008,2007,2006,2005,2004,2003,2002,2001,2000,1999,1998,1997,1996,1995,1994,1993,1992,1991,1990,1989,1988,1987,1986,1985,1984,1983,1982,1981,1980,1979,1978,1977,1976,1975,1974,1973,1972,1971
Estas estatísticas em outros países:
AfghanistanAlbaniaAlgeriaAndorraAngolaAntigua and BarbudaArab WorldArgentinaArmeniaArubaAustraliaAustriaAzerbaijanBahamas, TheBahrainBangladeshBarbadosBelarusBelgiumBelizeBeninBermudaBhutanBoliviaBosnia and HerzegovinaBotswanaBrazilBritish Virgin IslandsBrunei DarussalamBulgariaBurkina FasoBurundiCabo VerdeCambodiaCameroonCanadaCaribbean small statesCayman IslandsCentral African RepublicCentral Europe and the BalticsChadChileChinaColombiaComorosCongo, Dem. Rep.Congo, Rep.Costa RicaCote d'IvoireCroatiaCubaCuracaoCyprusCzech RepublicDenmarkDjiboutiDominicaDominican RepublicEarly-demographic dividendEast Asia & PacificEast Asia & Pacific (excluding high income)East Asia & Pacific (IDA & IBRD countries)EcuadorEgypt, Arab Rep.El SalvadorEquatorial GuineaEritreaEstoniaEthiopiaEuro areaEurope & Central AsiaEurope & Central Asia (excluding high income)Europe & Central Asia (IDA & IBRD countries)European UnionFijiFinlandFragile and conflict affected situationsFranceGabonGambia, TheGeorgiaGermanyGhanaGibraltarGreeceGrenadaGuatemalaGuineaGuinea-BissauGuyanaHaitiHeavily indebted poor countries (HIPC)High incomeHondurasHong Kong SAR, ChinaHungaryIBRD onlyIcelandIDA & IBRD totalIDA blendIDA onlyIDA totalIndiaIndonesiaIran, Islamic Rep.IraqIrelandIsraelItalyJamaicaJapanJordanKazakhstanKenyaKiribatiKorea, Rep.KuwaitKyrgyz RepublicLao PDRLate-demographic dividendLatin America & Caribbean Latin America & Caribbean (excluding high income)Latin America & the Caribbean (IDA & IBRD countries)LatviaLeast developed countries: UN classificationLebanonLesothoLiberiaLibyaLiechtensteinLithuaniaLow & middle incomeLow incomeLower middle incomeLuxembourgMacao SAR, ChinaMacedonia, FYRMadagascarMalawiMalaysiaMaldivesMaliMaltaMarshall IslandsMauritaniaMauritiusMexicoMiddle East & North AfricaMiddle East & North Africa (excluding high income)Middle East & North Africa (IDA & IBRD countries)Middle incomeMoldovaMonacoMongoliaMoroccoMozambiqueMyanmarNamibiaNauruNepalNetherlandsNew ZealandNicaraguaNigerNigeriaNorth AmericaNorwayOECD membersOmanOther small statesPacific island small statesPakistanPalauPanamaPapua New GuineaParaguayPeruPhilippinesPolandPortugalPost-demographic dividendPre-demographic dividendPuerto RicoQatarRomaniaRussian FederationRwandaSamoaSan MarinoSao Tome and PrincipeSaudi ArabiaSenegalSerbiaSeychellesSierra LeoneSingaporeSlovak RepublicSloveniaSmall statesSolomon IslandsSomaliaSouth AfricaSouth AsiaSouth Asia (IDA & IBRD)SpainSri LankaSt. Kitts and NevisSt. LuciaSt. Vincent and the GrenadinesSub-Saharan Africa Sub-Saharan Africa (excluding high income)Sub-Saharan Africa (IDA & IBRD countries)SudanSurinameSwazilandSwedenSwitzerlandSyrian Arab RepublicTajikistanTanzaniaThailandTimor-LesteTogoTongaTrinidad and TobagoTunisiaTurkeyTurks and Caicos IslandsTuvaluUgandaUkraineUnited Arab EmiratesUnited KingdomUnited StatesUpper middle incomeUruguayVanuatuVenezuela, RBVietnamWest Bank and GazaWorldYemen, Rep.ZambiaZimbabwe Linha do tempo:
Nesta escala de tempo está apresentado um gráfico de 1971 ano até 2015 ano Pre-demographic dividend. Dados de 1970 ano ausente. O número de observações reais por data: 45.
Fonte (nome):
Indicadores de desenvolvimento mundial
Fonte (organização):
UNESCO Institute for Statistics
Categorias:
Education
Foi atualizado:
23 abr 2017 ano
Indicadores de alterações dos valores ao longo dos anos
Mínimo:
7.755
1 jan 2005 ano
Máximo:
17.598
1 jan 1972 ano
Na data de observação
Valor
Mudança absoluta
A alteração em relação ao valor anterior
1 jan 1971 ano
16.396
+16.396
0.0%
1 jan 1972 ano
17.598
+1.202
7.33%
1 jan 1973 ano
15.081
-2.518
-14.31%
1 jan 1974 ano
14.455
-0.626
-4.15%
1 jan 1975 ano
13.589
-0.866
-5.99%
1 jan 1976 ano
12.945
-0.644
-4.74%
1 jan 1977 ano
12.121
-0.824
-6.36%
1 jan 1978 ano
11.738
-0.383
-3.16%
1 jan 1979 ano
11.623
-0.115
-0.98%
1 jan 1980 ano
11.259
-0.364
-3.13%
1 jan 1981 ano
10.814
-0.445
-3.95%
1 jan 1982 ano
10.729
-0.085
-0.79%
1 jan 1983 ano
10.943
+0.214
1.99%
1 jan 1984 ano
10.65
-0.292
-2.67%
1 jan 1985 ano
10.414
-0.236
-2.22%
1 jan 1986 ano
10.203
-0.211
-2.03%
1 jan 1987 ano
9.673
-0.53
-5.19%
1 jan 1988 ano
9.406
-0.267
-2.76%
1 jan 1989 ano
9.076
-0.329
-3.5%
1 jan 1990 ano
8.797
-0.279
-3.08%
1 jan 1991 ano
8.651
-0.146
-1.66%
1 jan 1992 ano
8.3
-0.351
-4.06%
1 jan 1993 ano
8.4
+0.1
1.21%
1 jan 1994 ano
8.213
-0.187
-2.22%
1 jan 1995 ano
7.957
-0.256
-3.11%
1 jan 1996 ano
8.388
+0.431
5.41%
1 jan 1997 ano
8.248
-0.14
-1.67%
1 jan 1998 ano
8.074
-0.173
-2.1%
1 jan 1999 ano
8.152
+0.078
0.96%
1 jan 2000 ano
8.092
-0.06
-0.74%
1 jan 2001 ano
8.113
+0.021
0.26%
1 jan 2002 ano
8.241
+0.128
1.58%
1 jan 2003 ano
8.046
-0.195
-2.36%
1 jan 2004 ano
7.763
-0.283
-3.52%
1 jan 2005 ano
7.755
-0.008
-0.1%
1 jan 2006 ano
7.811
+0.056
0.73%
1 jan 2007 ano
8.031
+0.219
2.81%
1 jan 2008 ano
8.31
+0.279
3.48%
1 jan 2009 ano
8.546
+0.236
2.85%
1 jan 2010 ano
9.041
+0.495
5.79%
1 jan 2011 ano
9.439
+0.398
4.41%
1 jan 2012 ano
9.355
-0.084
-0.89%
1 jan 2013 ano
9.676
+0.321
3.43%
1 jan 2014 ano
9.968
+0.292
3.01%
1 jan 2015 ano
10.037
+0.069
0.69%
Classificação de países por estatísticas atuais por anos


Comentários: