29
/pt/
pt
AIzaSyAYiBZKx7MnpbEhh9jyipgxe19OcubqV5w
April 1, 2024
49371
Middle East & North Africa (excluding high income)
MNA
false
2
1
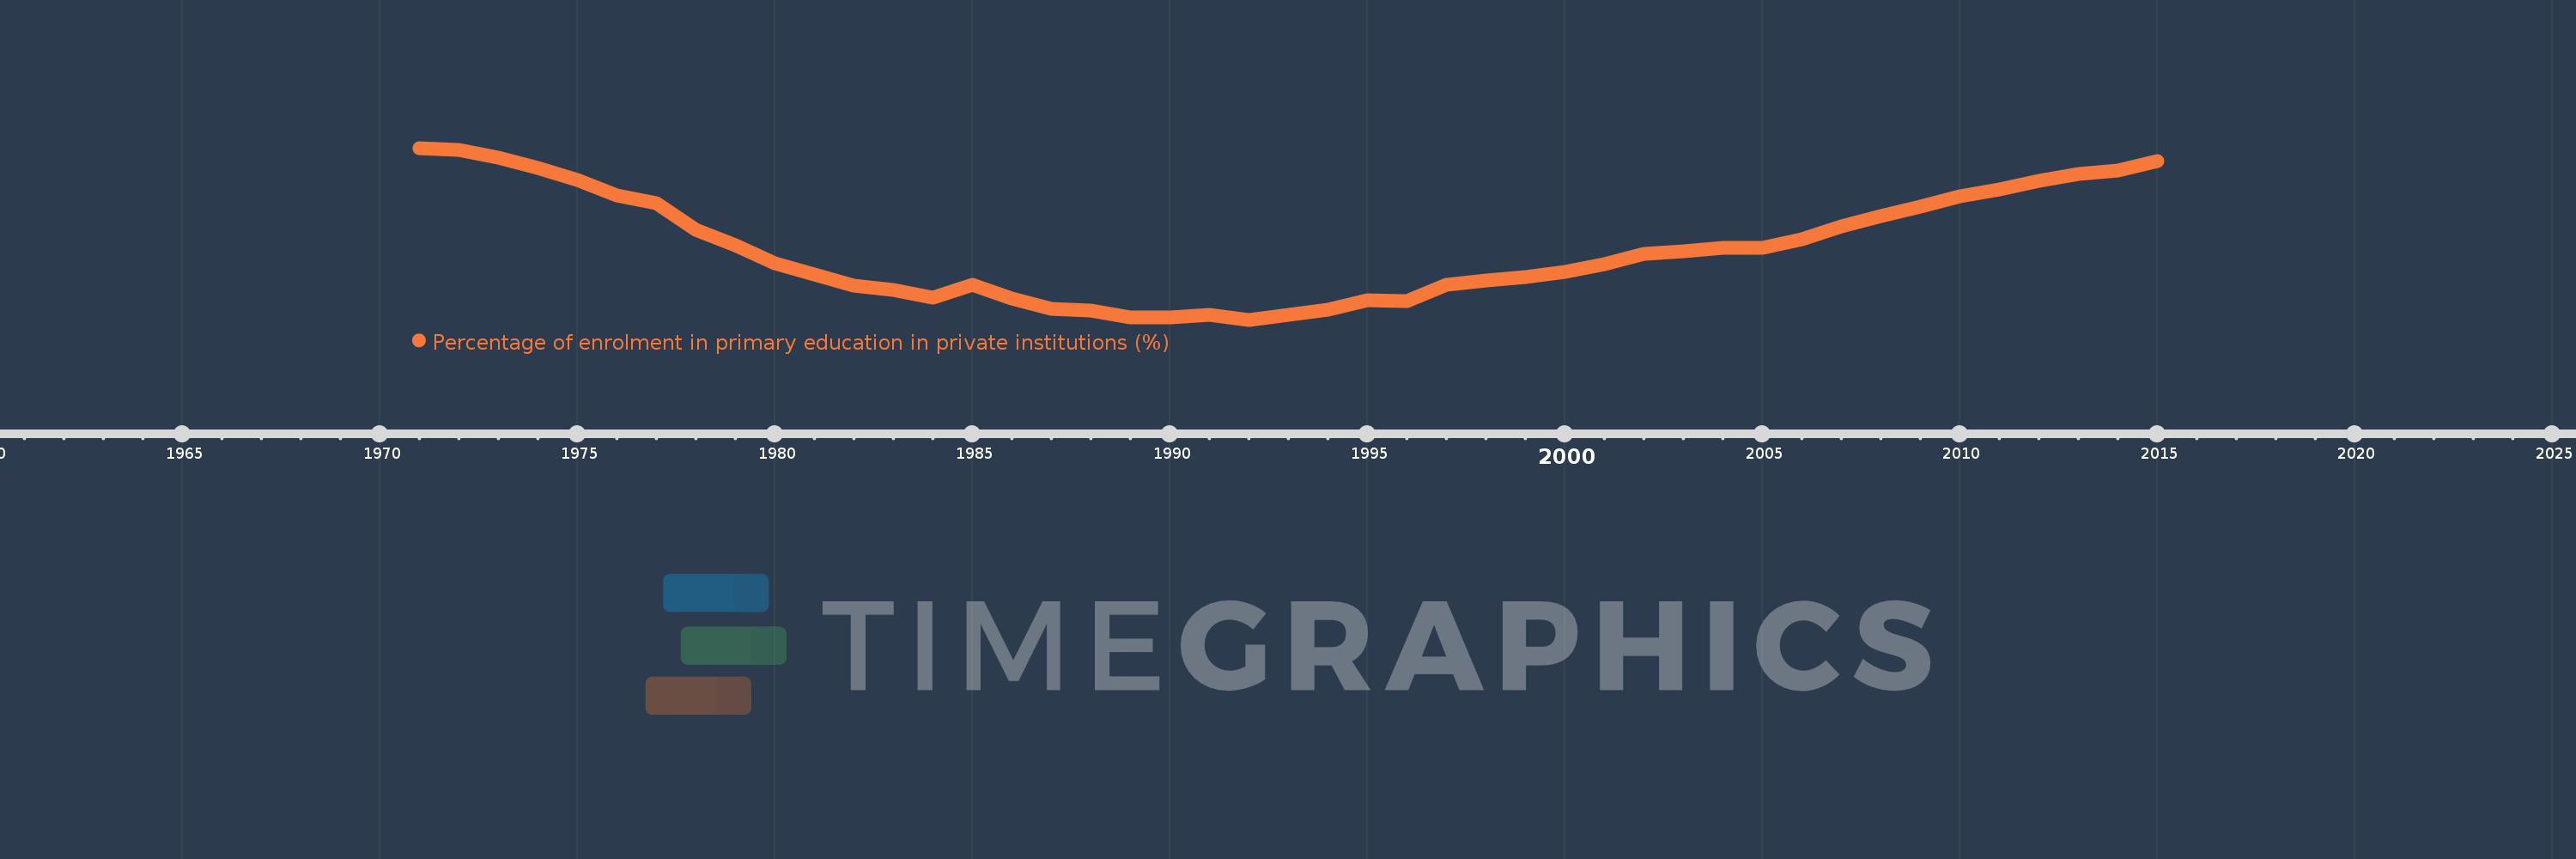
Percentage of enrolment in primary education in private institutions (%)
2015,2014,2013,2012,2011,2010,2009,2008,2007,2006,2005,2004,2003,2002,2001,2000,1999,1998,1997,1996,1995,1994,1993,1992,1991,1990,1989,1988,1987,1986,1985,1984,1983,1982,1981,1980,1979,1978,1977,1976,1975,1974,1973,1972,1971
Estas estatísticas em outros países:
AfghanistanAlbaniaAlgeriaAndorraAngolaAntigua and BarbudaArab WorldArgentinaArmeniaArubaAustraliaAustriaAzerbaijanBahamas, TheBahrainBangladeshBarbadosBelarusBelgiumBelizeBeninBermudaBhutanBoliviaBosnia and HerzegovinaBotswanaBrazilBritish Virgin IslandsBrunei DarussalamBulgariaBurkina FasoBurundiCabo VerdeCambodiaCameroonCanadaCaribbean small statesCayman IslandsCentral African RepublicCentral Europe and the BalticsChadChileChinaColombiaComorosCongo, Dem. Rep.Congo, Rep.Costa RicaCote d'IvoireCroatiaCubaCuracaoCyprusCzech RepublicDenmarkDjiboutiDominicaDominican RepublicEarly-demographic dividendEast Asia & PacificEast Asia & Pacific (excluding high income)East Asia & Pacific (IDA & IBRD countries)EcuadorEgypt, Arab Rep.El SalvadorEquatorial GuineaEritreaEstoniaEthiopiaEuro areaEurope & Central AsiaEurope & Central Asia (excluding high income)Europe & Central Asia (IDA & IBRD countries)European UnionFijiFinlandFragile and conflict affected situationsFranceGabonGambia, TheGeorgiaGermanyGhanaGibraltarGreeceGrenadaGuatemalaGuineaGuinea-BissauGuyanaHaitiHeavily indebted poor countries (HIPC)High incomeHondurasHong Kong SAR, ChinaHungaryIBRD onlyIcelandIDA & IBRD totalIDA blendIDA onlyIDA totalIndiaIndonesiaIran, Islamic Rep.IraqIrelandIsraelItalyJamaicaJapanJordanKazakhstanKenyaKiribatiKorea, Rep.KuwaitKyrgyz RepublicLao PDRLate-demographic dividendLatin America & Caribbean Latin America & Caribbean (excluding high income)Latin America & the Caribbean (IDA & IBRD countries)LatviaLeast developed countries: UN classificationLebanonLesothoLiberiaLibyaLiechtensteinLithuaniaLow & middle incomeLow incomeLower middle incomeLuxembourgMacao SAR, ChinaMacedonia, FYRMadagascarMalawiMalaysiaMaldivesMaliMaltaMarshall IslandsMauritaniaMauritiusMexicoMiddle East & North AfricaMiddle East & North Africa (excluding high income)Middle East & North Africa (IDA & IBRD countries)Middle incomeMoldovaMonacoMongoliaMoroccoMozambiqueMyanmarNamibiaNauruNepalNetherlandsNew ZealandNicaraguaNigerNigeriaNorth AmericaNorwayOECD membersOmanOther small statesPacific island small statesPakistanPalauPanamaPapua New GuineaParaguayPeruPhilippinesPolandPortugalPost-demographic dividendPre-demographic dividendPuerto RicoQatarRomaniaRussian FederationRwandaSamoaSan MarinoSao Tome and PrincipeSaudi ArabiaSenegalSerbiaSeychellesSierra LeoneSingaporeSlovak RepublicSloveniaSmall statesSolomon IslandsSomaliaSouth AfricaSouth AsiaSouth Asia (IDA & IBRD)SpainSri LankaSt. Kitts and NevisSt. LuciaSt. Vincent and the GrenadinesSub-Saharan Africa Sub-Saharan Africa (excluding high income)Sub-Saharan Africa (IDA & IBRD countries)SudanSurinameSwazilandSwedenSwitzerlandSyrian Arab RepublicTajikistanTanzaniaThailandTimor-LesteTogoTongaTrinidad and TobagoTunisiaTurkeyTurks and Caicos IslandsTuvaluUgandaUkraineUnited Arab EmiratesUnited KingdomUnited StatesUpper middle incomeUruguayVanuatuVenezuela, RBVietnamWest Bank and GazaWorldYemen, Rep.ZambiaZimbabwe Linha do tempo:
Nesta escala de tempo está apresentado um gráfico de 1971 ano até 2015 ano Middle East & North Africa (excluding high income). Dados de 1970 ano ausente. O número de observações reais por data: 45.
Fonte (nome):
Indicadores de desenvolvimento mundial
Fonte (organização):
UNESCO Institute for Statistics
Categorias:
Education
Foi atualizado:
23 abr 2017 ano
Indicadores de alterações dos valores ao longo dos anos
Mínimo:
3.242
1 jan 1992 ano
Máximo:
8.13
1 jan 1971 ano
Na data de observação
Valor
Mudança absoluta
A alteração em relação ao valor anterior
1 jan 1971 ano
8.13
+8.13
0.0%
1 jan 1972 ano
8.082
-0.048
-0.59%
1 jan 1973 ano
7.846
-0.236
-2.93%
1 jan 1974 ano
7.557
-0.288
-3.67%
1 jan 1975 ano
7.209
-0.348
-4.61%
1 jan 1976 ano
6.784
-0.425
-5.89%
1 jan 1977 ano
6.547
-0.237
-3.49%
1 jan 1978 ano
5.792
-0.755
-11.54%
1 jan 1979 ano
5.361
-0.431
-7.45%
1 jan 1980 ano
4.853
-0.508
-9.47%
1 jan 1981 ano
4.522
-0.331
-6.82%
1 jan 1982 ano
4.211
-0.311
-6.87%
1 jan 1983 ano
4.078
-0.133
-3.17%
1 jan 1984 ano
3.863
-0.215
-5.27%
1 jan 1985 ano
4.225
+0.362
9.38%
1 jan 1986 ano
3.848
-0.378
-8.94%
1 jan 1987 ano
3.541
-0.307
-7.97%
1 jan 1988 ano
3.497
-0.044
-1.24%
1 jan 1989 ano
3.296
-0.2
-5.73%
1 jan 1990 ano
3.309
+0.013
0.39%
1 jan 1991 ano
3.374
+0.065
1.97%
1 jan 1992 ano
3.242
-0.132
-3.91%
1 jan 1993 ano
3.375
+0.133
4.09%
1 jan 1994 ano
3.516
+0.141
4.19%
1 jan 1995 ano
3.802
+0.286
8.13%
1 jan 1996 ano
3.779
-0.023
-0.6%
1 jan 1997 ano
4.247
+0.468
12.38%
1 jan 1998 ano
4.367
+0.119
2.81%
1 jan 1999 ano
4.449
+0.083
1.9%
1 jan 2000 ano
4.596
+0.147
3.3%
1 jan 2001 ano
4.817
+0.221
4.81%
1 jan 2002 ano
5.11
+0.292
6.07%
1 jan 2003 ano
5.2
+0.09
1.76%
1 jan 2004 ano
5.282
+0.083
1.59%
1 jan 2005 ano
5.281
-0.001
-0.02%
1 jan 2006 ano
5.527
+0.246
4.66%
1 jan 2007 ano
5.91
+0.383
6.92%
1 jan 2008 ano
6.204
+0.294
4.97%
1 jan 2009 ano
6.464
+0.26
4.19%
1 jan 2010 ano
6.759
+0.295
4.56%
1 jan 2011 ano
6.959
+0.2
2.96%
1 jan 2012 ano
7.203
+0.244
3.5%
1 jan 2013 ano
7.384
+0.181
2.51%
1 jan 2014 ano
7.49
+0.106
1.44%
1 jan 2015 ano
7.763
+0.273
3.65%
Classificação de países por estatísticas atuais por anos


Comentários: