29
/pt/
pt
AIzaSyAYiBZKx7MnpbEhh9jyipgxe19OcubqV5w
April 1, 2024
55059
Post-demographic dividend
PST
false
2
1
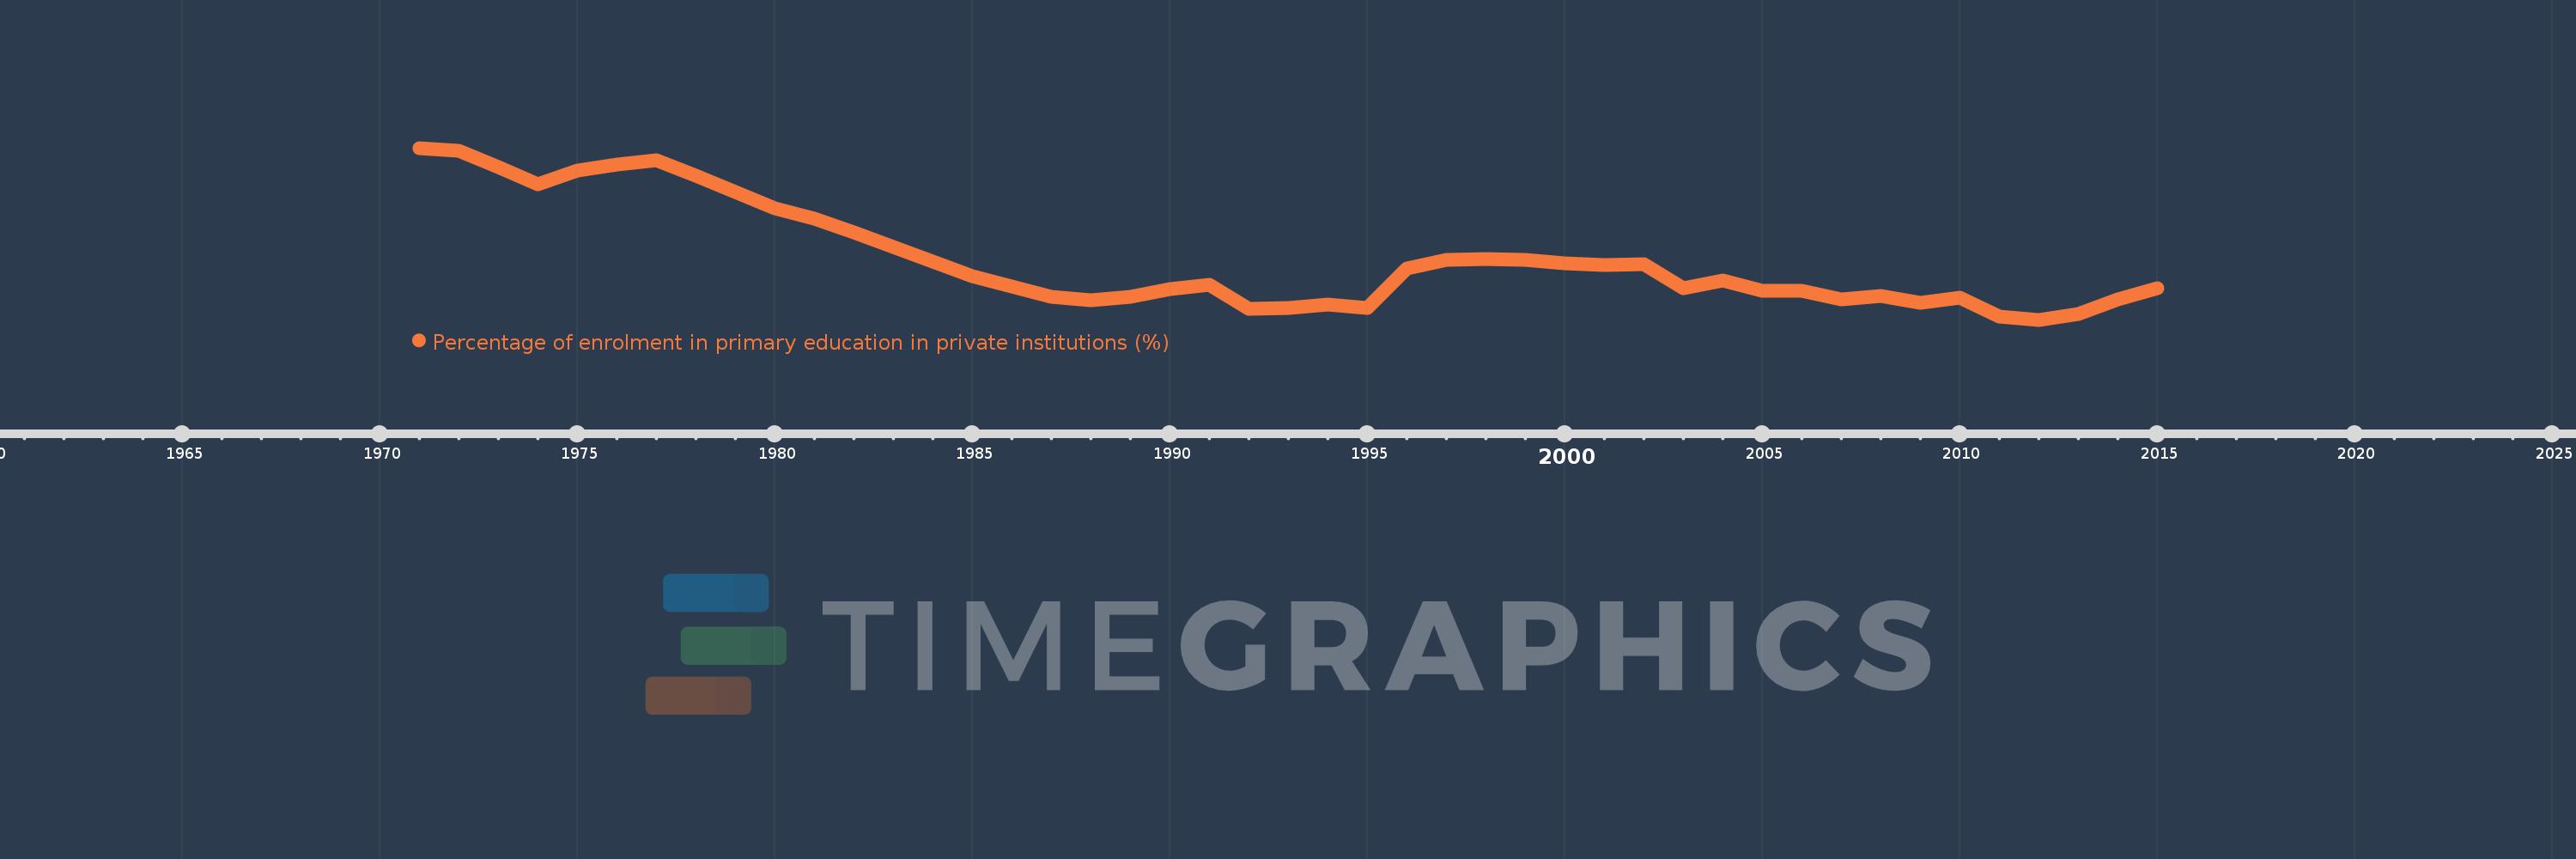
Percentage of enrolment in primary education in private institutions (%)
2015,2014,2013,2012,2011,2010,2009,2008,2007,2006,2005,2004,2003,2002,2001,2000,1999,1998,1997,1996,1995,1994,1993,1992,1991,1990,1989,1988,1987,1986,1985,1984,1983,1982,1981,1980,1979,1978,1977,1976,1975,1974,1973,1972,1971
Estas estatísticas em outros países:
AfghanistanAlbaniaAlgeriaAndorraAngolaAntigua and BarbudaArab WorldArgentinaArmeniaArubaAustraliaAustriaAzerbaijanBahamas, TheBahrainBangladeshBarbadosBelarusBelgiumBelizeBeninBermudaBhutanBoliviaBosnia and HerzegovinaBotswanaBrazilBritish Virgin IslandsBrunei DarussalamBulgariaBurkina FasoBurundiCabo VerdeCambodiaCameroonCanadaCaribbean small statesCayman IslandsCentral African RepublicCentral Europe and the BalticsChadChileChinaColombiaComorosCongo, Dem. Rep.Congo, Rep.Costa RicaCote d'IvoireCroatiaCubaCuracaoCyprusCzech RepublicDenmarkDjiboutiDominicaDominican RepublicEarly-demographic dividendEast Asia & PacificEast Asia & Pacific (excluding high income)East Asia & Pacific (IDA & IBRD countries)EcuadorEgypt, Arab Rep.El SalvadorEquatorial GuineaEritreaEstoniaEthiopiaEuro areaEurope & Central AsiaEurope & Central Asia (excluding high income)Europe & Central Asia (IDA & IBRD countries)European UnionFijiFinlandFragile and conflict affected situationsFranceGabonGambia, TheGeorgiaGermanyGhanaGibraltarGreeceGrenadaGuatemalaGuineaGuinea-BissauGuyanaHaitiHeavily indebted poor countries (HIPC)High incomeHondurasHong Kong SAR, ChinaHungaryIBRD onlyIcelandIDA & IBRD totalIDA blendIDA onlyIDA totalIndiaIndonesiaIran, Islamic Rep.IraqIrelandIsraelItalyJamaicaJapanJordanKazakhstanKenyaKiribatiKorea, Rep.KuwaitKyrgyz RepublicLao PDRLate-demographic dividendLatin America & Caribbean Latin America & Caribbean (excluding high income)Latin America & the Caribbean (IDA & IBRD countries)LatviaLeast developed countries: UN classificationLebanonLesothoLiberiaLibyaLiechtensteinLithuaniaLow & middle incomeLow incomeLower middle incomeLuxembourgMacao SAR, ChinaMacedonia, FYRMadagascarMalawiMalaysiaMaldivesMaliMaltaMarshall IslandsMauritaniaMauritiusMexicoMiddle East & North AfricaMiddle East & North Africa (excluding high income)Middle East & North Africa (IDA & IBRD countries)Middle incomeMoldovaMonacoMongoliaMoroccoMozambiqueMyanmarNamibiaNauruNepalNetherlandsNew ZealandNicaraguaNigerNigeriaNorth AmericaNorwayOECD membersOmanOther small statesPacific island small statesPakistanPalauPanamaPapua New GuineaParaguayPeruPhilippinesPolandPortugalPost-demographic dividendPre-demographic dividendPuerto RicoQatarRomaniaRussian FederationRwandaSamoaSan MarinoSao Tome and PrincipeSaudi ArabiaSenegalSerbiaSeychellesSierra LeoneSingaporeSlovak RepublicSloveniaSmall statesSolomon IslandsSomaliaSouth AfricaSouth AsiaSouth Asia (IDA & IBRD)SpainSri LankaSt. Kitts and NevisSt. LuciaSt. Vincent and the GrenadinesSub-Saharan Africa Sub-Saharan Africa (excluding high income)Sub-Saharan Africa (IDA & IBRD countries)SudanSurinameSwazilandSwedenSwitzerlandSyrian Arab RepublicTajikistanTanzaniaThailandTimor-LesteTogoTongaTrinidad and TobagoTunisiaTurkeyTurks and Caicos IslandsTuvaluUgandaUkraineUnited Arab EmiratesUnited KingdomUnited StatesUpper middle incomeUruguayVanuatuVenezuela, RBVietnamWest Bank and GazaWorldYemen, Rep.ZambiaZimbabwe Linha do tempo:
Nesta escala de tempo está apresentado um gráfico de 1971 ano até 2015 ano Post-demographic dividend. Dados de 1970 ano ausente. O número de observações reais por data: 45.
Fonte (nome):
Indicadores de desenvolvimento mundial
Fonte (organização):
UNESCO Institute for Statistics
Categorias:
Education
Foi atualizado:
23 abr 2017 ano
Indicadores de alterações dos valores ao longo dos anos
Mínimo:
8.874
1 jan 2012 ano
Máximo:
12.075
1 jan 1971 ano
Na data de observação
Valor
Mudança absoluta
A alteração em relação ao valor anterior
1 jan 1971 ano
12.075
+12.075
0.0%
1 jan 1972 ano
12.023
-0.052
-0.43%
1 jan 1973 ano
11.712
-0.311
-2.59%
1 jan 1974 ano
11.394
-0.318
-2.72%
1 jan 1975 ano
11.649
+0.255
2.24%
1 jan 1976 ano
11.765
+0.116
0.99%
1 jan 1977 ano
11.854
+0.089
0.76%
1 jan 1978 ano
11.556
-0.299
-2.52%
1 jan 1979 ano
11.257
-0.298
-2.58%
1 jan 1980 ano
10.953
-0.304
-2.7%
1 jan 1981 ano
10.761
-0.192
-1.75%
1 jan 1982 ano
10.498
-0.263
-2.44%
1 jan 1983 ano
10.222
-0.276
-2.63%
1 jan 1984 ano
9.961
-0.261
-2.55%
1 jan 1985 ano
9.686
-0.276
-2.77%
1 jan 1986 ano
9.489
-0.197
-2.04%
1 jan 1987 ano
9.299
-0.19
-2.0%
1 jan 1988 ano
9.234
-0.065
-0.7%
1 jan 1989 ano
9.303
+0.069
0.75%
1 jan 1990 ano
9.443
+0.14
1.51%
1 jan 1991 ano
9.533
+0.09
0.95%
1 jan 1992 ano
9.075
-0.458
-4.8%
1 jan 1993 ano
9.088
+0.012
0.14%
1 jan 1994 ano
9.153
+0.065
0.71%
1 jan 1995 ano
9.089
-0.064
-0.69%
1 jan 1996 ano
9.832
+0.743
8.17%
1 jan 1997 ano
9.994
+0.162
1.65%
1 jan 1998 ano
10.003
+0.009
0.09%
1 jan 1999 ano
9.982
-0.021
-0.21%
1 jan 2000 ano
9.922
-0.06
-0.6%
1 jan 2001 ano
9.9
-0.022
-0.22%
1 jan 2002 ano
9.903
+0.002
0.02%
1 jan 2003 ano
9.455
-0.447
-4.52%
1 jan 2004 ano
9.608
+0.152
1.61%
1 jan 2005 ano
9.414
-0.193
-2.01%
1 jan 2006 ano
9.408
-0.007
-0.07%
1 jan 2007 ano
9.251
-0.157
-1.66%
1 jan 2008 ano
9.31
+0.059
0.64%
1 jan 2009 ano
9.197
-0.113
-1.21%
1 jan 2010 ano
9.289
+0.092
1.0%
1 jan 2011 ano
8.928
-0.361
-3.89%
1 jan 2012 ano
8.874
-0.054
-0.6%
1 jan 2013 ano
8.988
+0.113
1.28%
1 jan 2014 ano
9.249
+0.261
2.91%
1 jan 2015 ano
9.457
+0.208
2.25%
Classificação de países por estatísticas atuais por anos


Comentários: