29
/pt/
pt
AIzaSyAYiBZKx7MnpbEhh9jyipgxe19OcubqV5w
April 1, 2024
40220
IDA total
IDA
false
2
1
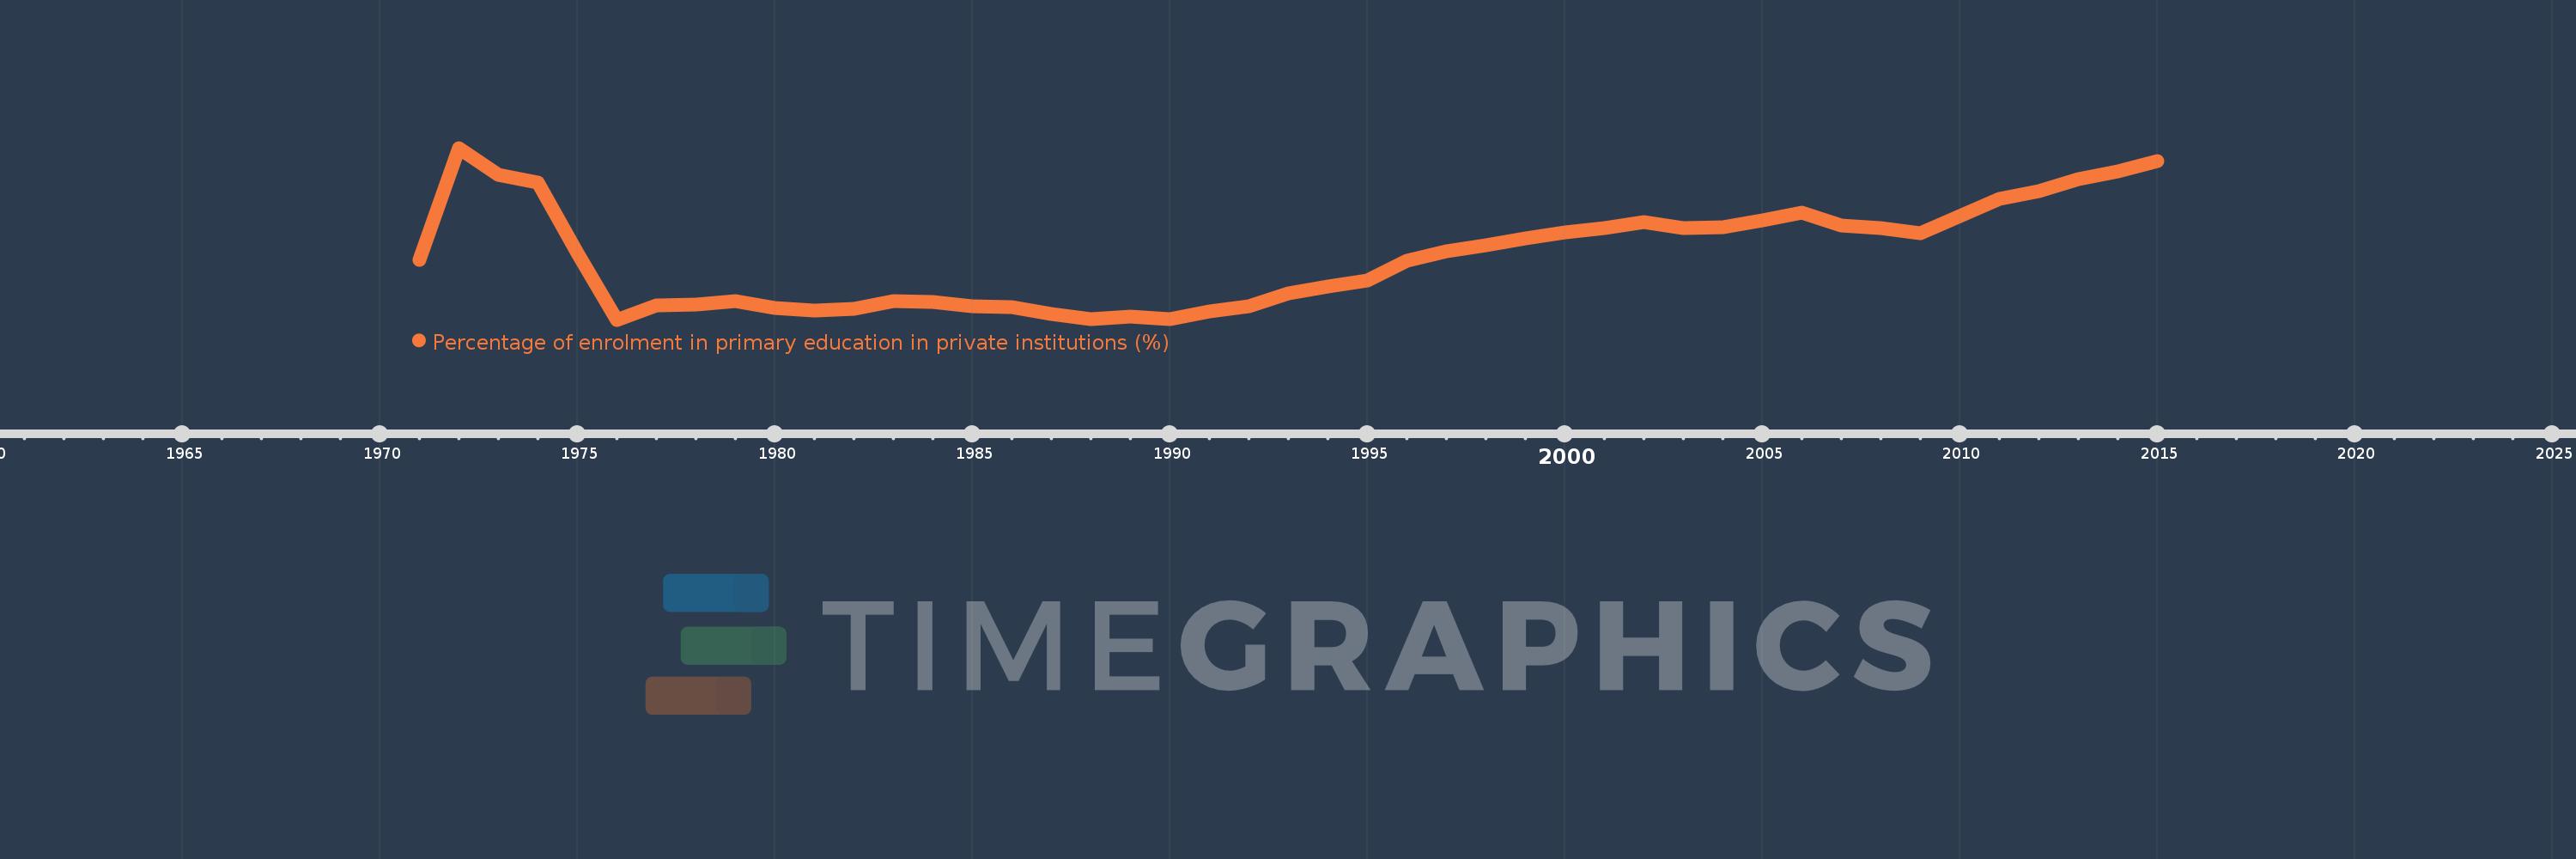
Percentage of enrolment in primary education in private institutions (%)
2015,2014,2013,2012,2011,2010,2009,2008,2007,2006,2005,2004,2003,2002,2001,2000,1999,1998,1997,1996,1995,1994,1993,1992,1991,1990,1989,1988,1987,1986,1985,1984,1983,1982,1981,1980,1979,1978,1977,1976,1975,1974,1973,1972,1971
Estas estatísticas em outros países:
AfghanistanAlbaniaAlgeriaAndorraAngolaAntigua and BarbudaArab WorldArgentinaArmeniaArubaAustraliaAustriaAzerbaijanBahamas, TheBahrainBangladeshBarbadosBelarusBelgiumBelizeBeninBermudaBhutanBoliviaBosnia and HerzegovinaBotswanaBrazilBritish Virgin IslandsBrunei DarussalamBulgariaBurkina FasoBurundiCabo VerdeCambodiaCameroonCanadaCaribbean small statesCayman IslandsCentral African RepublicCentral Europe and the BalticsChadChileChinaColombiaComorosCongo, Dem. Rep.Congo, Rep.Costa RicaCote d'IvoireCroatiaCubaCuracaoCyprusCzech RepublicDenmarkDjiboutiDominicaDominican RepublicEarly-demographic dividendEast Asia & PacificEast Asia & Pacific (excluding high income)East Asia & Pacific (IDA & IBRD countries)EcuadorEgypt, Arab Rep.El SalvadorEquatorial GuineaEritreaEstoniaEthiopiaEuro areaEurope & Central AsiaEurope & Central Asia (excluding high income)Europe & Central Asia (IDA & IBRD countries)European UnionFijiFinlandFragile and conflict affected situationsFranceGabonGambia, TheGeorgiaGermanyGhanaGibraltarGreeceGrenadaGuatemalaGuineaGuinea-BissauGuyanaHaitiHeavily indebted poor countries (HIPC)High incomeHondurasHong Kong SAR, ChinaHungaryIBRD onlyIcelandIDA & IBRD totalIDA blendIDA onlyIDA totalIndiaIndonesiaIran, Islamic Rep.IraqIrelandIsraelItalyJamaicaJapanJordanKazakhstanKenyaKiribatiKorea, Rep.KuwaitKyrgyz RepublicLao PDRLate-demographic dividendLatin America & Caribbean Latin America & Caribbean (excluding high income)Latin America & the Caribbean (IDA & IBRD countries)LatviaLeast developed countries: UN classificationLebanonLesothoLiberiaLibyaLiechtensteinLithuaniaLow & middle incomeLow incomeLower middle incomeLuxembourgMacao SAR, ChinaMacedonia, FYRMadagascarMalawiMalaysiaMaldivesMaliMaltaMarshall IslandsMauritaniaMauritiusMexicoMiddle East & North AfricaMiddle East & North Africa (excluding high income)Middle East & North Africa (IDA & IBRD countries)Middle incomeMoldovaMonacoMongoliaMoroccoMozambiqueMyanmarNamibiaNauruNepalNetherlandsNew ZealandNicaraguaNigerNigeriaNorth AmericaNorwayOECD membersOmanOther small statesPacific island small statesPakistanPalauPanamaPapua New GuineaParaguayPeruPhilippinesPolandPortugalPost-demographic dividendPre-demographic dividendPuerto RicoQatarRomaniaRussian FederationRwandaSamoaSan MarinoSao Tome and PrincipeSaudi ArabiaSenegalSerbiaSeychellesSierra LeoneSingaporeSlovak RepublicSloveniaSmall statesSolomon IslandsSomaliaSouth AfricaSouth AsiaSouth Asia (IDA & IBRD)SpainSri LankaSt. Kitts and NevisSt. LuciaSt. Vincent and the GrenadinesSub-Saharan Africa Sub-Saharan Africa (excluding high income)Sub-Saharan Africa (IDA & IBRD countries)SudanSurinameSwazilandSwedenSwitzerlandSyrian Arab RepublicTajikistanTanzaniaThailandTimor-LesteTogoTongaTrinidad and TobagoTunisiaTurkeyTurks and Caicos IslandsTuvaluUgandaUkraineUnited Arab EmiratesUnited KingdomUnited StatesUpper middle incomeUruguayVanuatuVenezuela, RBVietnamWest Bank and GazaWorldYemen, Rep.ZambiaZimbabwe Linha do tempo:
Nesta escala de tempo está apresentado um gráfico de 1971 ano até 2015 ano IDA total. Dados de 1970 ano ausente. O número de observações reais por data: 45.
Fonte (nome):
Indicadores de desenvolvimento mundial
Fonte (organização):
UNESCO Institute for Statistics
Categorias:
Education
Foi atualizado:
23 abr 2017 ano
Indicadores de alterações dos valores ao longo dos anos
Mínimo:
12.039
1 jan 1976 ano
Máximo:
16.283
1 jan 1972 ano
Na data de observação
Valor
Mudança absoluta
A alteração em relação ao valor anterior
1 jan 1971 ano
13.525
+13.525
0.0%
1 jan 1972 ano
16.283
+2.757
20.39%
1 jan 1973 ano
15.615
-0.668
-4.1%
1 jan 1974 ano
15.434
-0.18
-1.16%
1 jan 1975 ano
13.697
-1.737
-11.25%
1 jan 1976 ano
12.039
-1.659
-12.11%
1 jan 1977 ano
12.399
+0.361
3.0%
1 jan 1978 ano
12.414
+0.015
0.12%
1 jan 1979 ano
12.495
+0.081
0.65%
1 jan 1980 ano
12.339
-0.157
-1.25%
1 jan 1981 ano
12.264
-0.074
-0.6%
1 jan 1982 ano
12.316
+0.052
0.42%
1 jan 1983 ano
12.492
+0.176
1.43%
1 jan 1984 ano
12.473
-0.019
-0.15%
1 jan 1985 ano
12.376
-0.098
-0.78%
1 jan 1986 ano
12.355
-0.021
-0.17%
1 jan 1987 ano
12.179
-0.176
-1.42%
1 jan 1988 ano
12.055
-0.124
-1.01%
1 jan 1989 ano
12.118
+0.063
0.52%
1 jan 1990 ano
12.051
-0.067
-0.56%
1 jan 1991 ano
12.242
+0.192
1.59%
1 jan 1992 ano
12.366
+0.123
1.01%
1 jan 1993 ano
12.696
+0.331
2.67%
1 jan 1994 ano
12.868
+0.172
1.35%
1 jan 1995 ano
13.015
+0.147
1.14%
1 jan 1996 ano
13.499
+0.484
3.72%
1 jan 1997 ano
13.721
+0.222
1.64%
1 jan 1998 ano
13.887
+0.167
1.21%
1 jan 1999 ano
14.04
+0.153
1.1%
1 jan 2000 ano
14.205
+0.165
1.17%
1 jan 2001 ano
14.293
+0.089
0.62%
1 jan 2002 ano
14.454
+0.16
1.12%
1 jan 2003 ano
14.299
-0.155
-1.07%
1 jan 2004 ano
14.319
+0.02
0.14%
1 jan 2005 ano
14.489
+0.17
1.18%
1 jan 2006 ano
14.676
+0.187
1.29%
1 jan 2007 ano
14.375
-0.3
-2.05%
1 jan 2008 ano
14.312
-0.063
-0.44%
1 jan 2009 ano
14.173
-0.139
-0.97%
1 jan 2010 ano
14.6
+0.427
3.01%
1 jan 2011 ano
15.022
+0.422
2.89%
1 jan 2012 ano
15.222
+0.2
1.33%
1 jan 2013 ano
15.512
+0.29
1.9%
1 jan 2014 ano
15.698
+0.186
1.2%
1 jan 2015 ano
15.956
+0.259
1.65%
Classificação de países por estatísticas atuais por anos


Comentários: