29
/pt/
pt
AIzaSyAYiBZKx7MnpbEhh9jyipgxe19OcubqV5w
April 1, 2024
73722
Austria
AUT
true
2
1
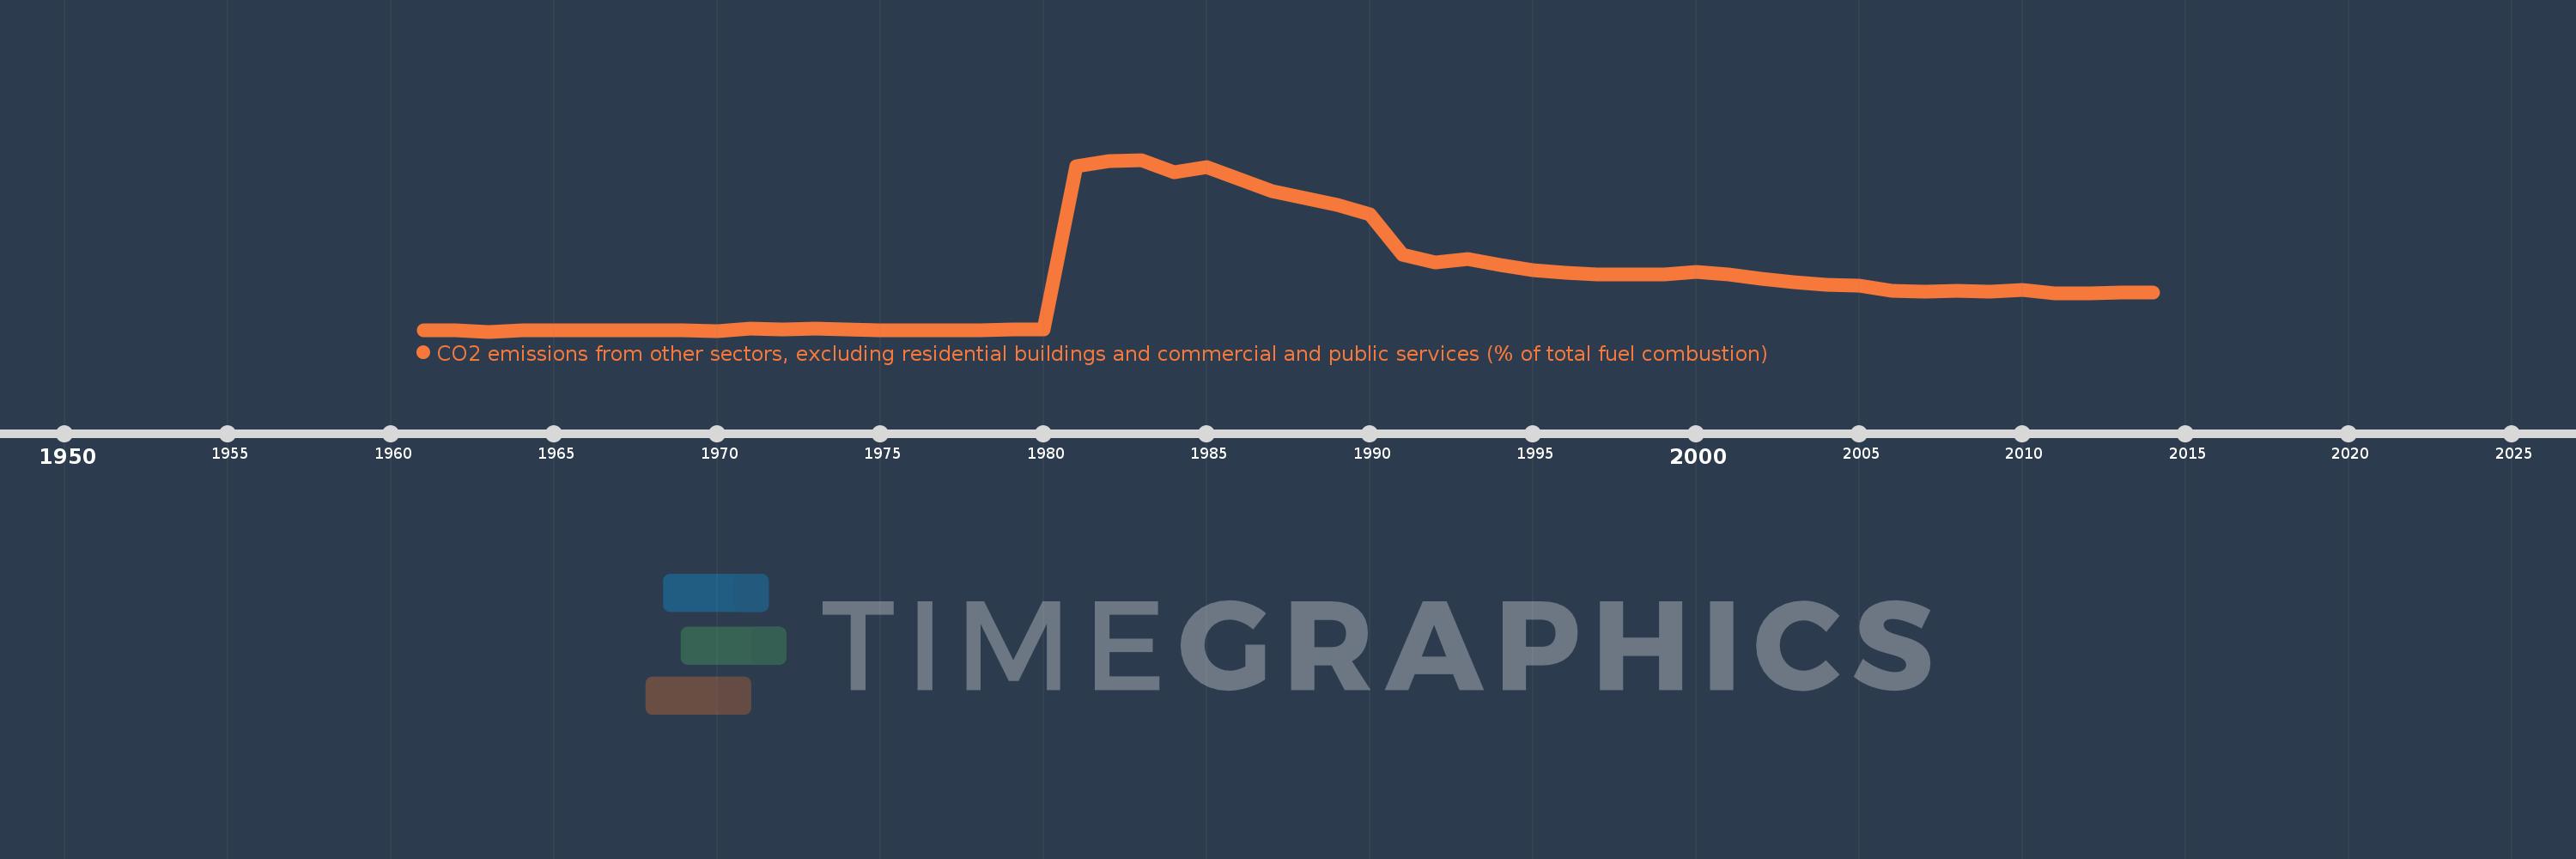
CO2 emissions from other sectors, excluding residential buildings and commercial and public services (% of total fuel combustion)
2014,2013,2012,2011,2010,2009,2008,2007,2006,2005,2004,2003,2002,2001,2000,1999,1998,1997,1996,1995,1994,1993,1992,1991,1990,1989,1988,1987,1986,1985,1984,1983,1982,1981,1980,1979,1978,1977,1976,1975,1974,1973,1972,1971,1970,1969,1968,1967,1966,1965,1964,1963,1962,1961
Estas estatísticas em outros países:
AlbaniaAlgeriaAngolaArab WorldArgentinaArmeniaAustraliaAustriaAzerbaijanBahrainBangladeshBelarusBelgiumBeninBoliviaBosnia and HerzegovinaBotswanaBrazilBrunei DarussalamBulgariaCambodiaCameroonCanadaCaribbean small statesCentral Europe and the BalticsChileChinaColombiaCongo, Dem. Rep.Congo, Rep.Costa RicaCote d'IvoireCroatiaCubaCuracaoCyprusCzech RepublicDenmarkDominican RepublicEarly-demographic dividendEast Asia & PacificEast Asia & Pacific (excluding high income)East Asia & Pacific (IDA & IBRD countries)EcuadorEgypt, Arab Rep.El SalvadorEritreaEstoniaEthiopiaEuro areaEurope & Central AsiaEurope & Central Asia (excluding high income)Europe & Central Asia (IDA & IBRD countries)European UnionFinlandFragile and conflict affected situationsFranceGabonGeorgiaGermanyGhanaGibraltarGreeceGuatemalaHaitiHeavily indebted poor countries (HIPC)High incomeHondurasHong Kong SAR, ChinaHungaryIBRD onlyIcelandIDA & IBRD totalIDA blendIDA onlyIDA totalIndiaIndonesiaIran, Islamic Rep.IraqIrelandIsraelItalyJamaicaJapanJordanKazakhstanKenyaKorea, Dem. People’s Rep.Korea, Rep.KosovoKuwaitKyrgyz RepublicLate-demographic dividendLatin America & Caribbean Latin America & Caribbean (excluding high income)Latin America & the Caribbean (IDA & IBRD countries)LatviaLeast developed countries: UN classificationLebanonLibyaLithuaniaLow & middle incomeLow incomeLower middle incomeLuxembourgMacedonia, FYRMalaysiaMaltaMauritiusMexicoMiddle East & North AfricaMiddle East & North Africa (excluding high income)Middle East & North Africa (IDA & IBRD countries)Middle incomeMoldovaMongoliaMontenegroMoroccoMozambiqueMyanmarNamibiaNepalNetherlandsNew ZealandNicaraguaNigerNigeriaNorth AmericaNorwayOECD membersOmanOther small statesPakistanPanamaParaguayPeruPhilippinesPolandPortugalPost-demographic dividendPre-demographic dividendQatarRomaniaRussian FederationSaudi ArabiaSenegalSerbiaSingaporeSlovak RepublicSloveniaSmall statesSouth AfricaSouth AsiaSouth Asia (IDA & IBRD)South SudanSpainSri LankaSub-Saharan Africa Sub-Saharan Africa (excluding high income)Sub-Saharan Africa (IDA & IBRD countries)SudanSwedenSwitzerlandSyrian Arab RepublicTajikistanTanzaniaThailandTogoTrinidad and TobagoTunisiaTurkeyTurkmenistanUkraineUnited Arab EmiratesUnited KingdomUnited StatesUpper middle incomeUruguayUzbekistanVenezuela, RBVietnamWorldYemen, Rep.ZambiaZimbabwe Linha do tempo:
Nesta escala de tempo está apresentado um gráfico de 1961 ano até 2014 ano Austria. Dados de 1960 ano ausente. O número de observações reais por data: 54.
Fonte (nome):
Indicadores de desenvolvimento mundial
Fonte (organização):
IEA Statistics © OECD/IEA 2014 (http://www.iea.org/stats/index.asp), subject to https://www.iea.org/t&c/termsandconditions/
Categorias:
Environment
Foi atualizado:
23 abr 2017 ano
Indicadores de alterações dos valores ao longo dos anos
Máximo:
4.943
1 jan 1983 ano
Na data de observação
Valor
Mudança absoluta
A alteração em relação ao valor anterior
1 jan 1961 ano
0.033
+0.033
0.0%
1 jan 1962 ano
0.033
0.0
-0.78%
1 jan 1963 ano
0.0
-0.033
-100.0%
1 jan 1964 ano
0.027
+0.027
-1418.62 trilhões%
1 jan 1965 ano
0.027
-0.001
-2.15%
1 jan 1966 ano
0.027
+0.001
2.5%
1 jan 1967 ano
0.027
0.0
-0.76%
1 jan 1968 ano
0.026
-0.001
-1.96%
1 jan 1969 ano
0.025
-0.002
-6.65%
1 jan 1970 ano
0.023
-0.001
-5.77%
1 jan 1971 ano
0.086
+0.063
269.78%
1 jan 1972 ano
0.062
-0.024
-28.3%
1 jan 1973 ano
0.079
+0.018
28.57%
1 jan 1974 ano
0.056
-0.024
-29.74%
1 jan 1975 ano
0.039
-0.017
-29.84%
1 jan 1976 ano
0.04
+0.001
3.31%
1 jan 1977 ano
0.037
-0.003
-8.27%
1 jan 1978 ano
0.039
+0.002
5.11%
1 jan 1979 ano
0.056
+0.017
43.49%
1 jan 1980 ano
0.054
-0.002
-4.03%
1 jan 1981 ano
4.766
+4.713
8.78 mil%
1 jan 1982 ano
4.908
+0.142
2.97%
1 jan 1983 ano
4.943
+0.035
0.71%
1 jan 1984 ano
4.576
-0.367
-7.42%
1 jan 1985 ano
4.729
+0.153
3.35%
1 jan 1986 ano
4.388
-0.341
-7.21%
1 jan 1987 ano
4.048
-0.34
-7.75%
1 jan 1988 ano
3.837
-0.211
-5.2%
1 jan 1989 ano
3.636
-0.201
-5.25%
1 jan 1990 ano
3.374
-0.262
-7.2%
1 jan 1991 ano
2.208
-1.166
-34.57%
1 jan 1992 ano
1.989
-0.219
-9.91%
1 jan 1993 ano
2.092
+0.103
5.16%
1 jan 1994 ano
1.904
-0.187
-8.95%
1 jan 1995 ano
1.765
-0.139
-7.3%
1 jan 1996 ano
1.7
-0.066
-3.71%
1 jan 1997 ano
1.648
-0.052
-3.07%
1 jan 1998 ano
1.653
+0.005
0.33%
1 jan 1999 ano
1.653
+0.0
0.01%
1 jan 2000 ano
1.729
+0.076
4.62%
1 jan 2001 ano
1.637
-0.092
-5.32%
1 jan 2002 ano
1.529
-0.108
-6.6%
1 jan 2003 ano
1.433
-0.097
-6.32%
1 jan 2004 ano
1.356
-0.076
-5.34%
1 jan 2005 ano
1.323
-0.034
-2.49%
1 jan 2006 ano
1.186
-0.137
-10.35%
1 jan 2007 ano
1.158
-0.028
-2.35%
1 jan 2008 ano
1.167
+0.009
0.8%
1 jan 2009 ano
1.151
-0.016
-1.39%
1 jan 2010 ano
1.191
+0.04
3.47%
1 jan 2011 ano
1.09
-0.101
-8.46%
1 jan 2012 ano
1.101
+0.011
1.0%
1 jan 2013 ano
1.135
+0.034
3.1%
1 jan 2014 ano
1.121
-0.014
-1.26%
Classificação de países por estatísticas atuais por anos


Comentários: