29
/pt/
pt
AIzaSyAYiBZKx7MnpbEhh9jyipgxe19OcubqV5w
April 1, 2024
195302
Mexico
MEX
true
2
1
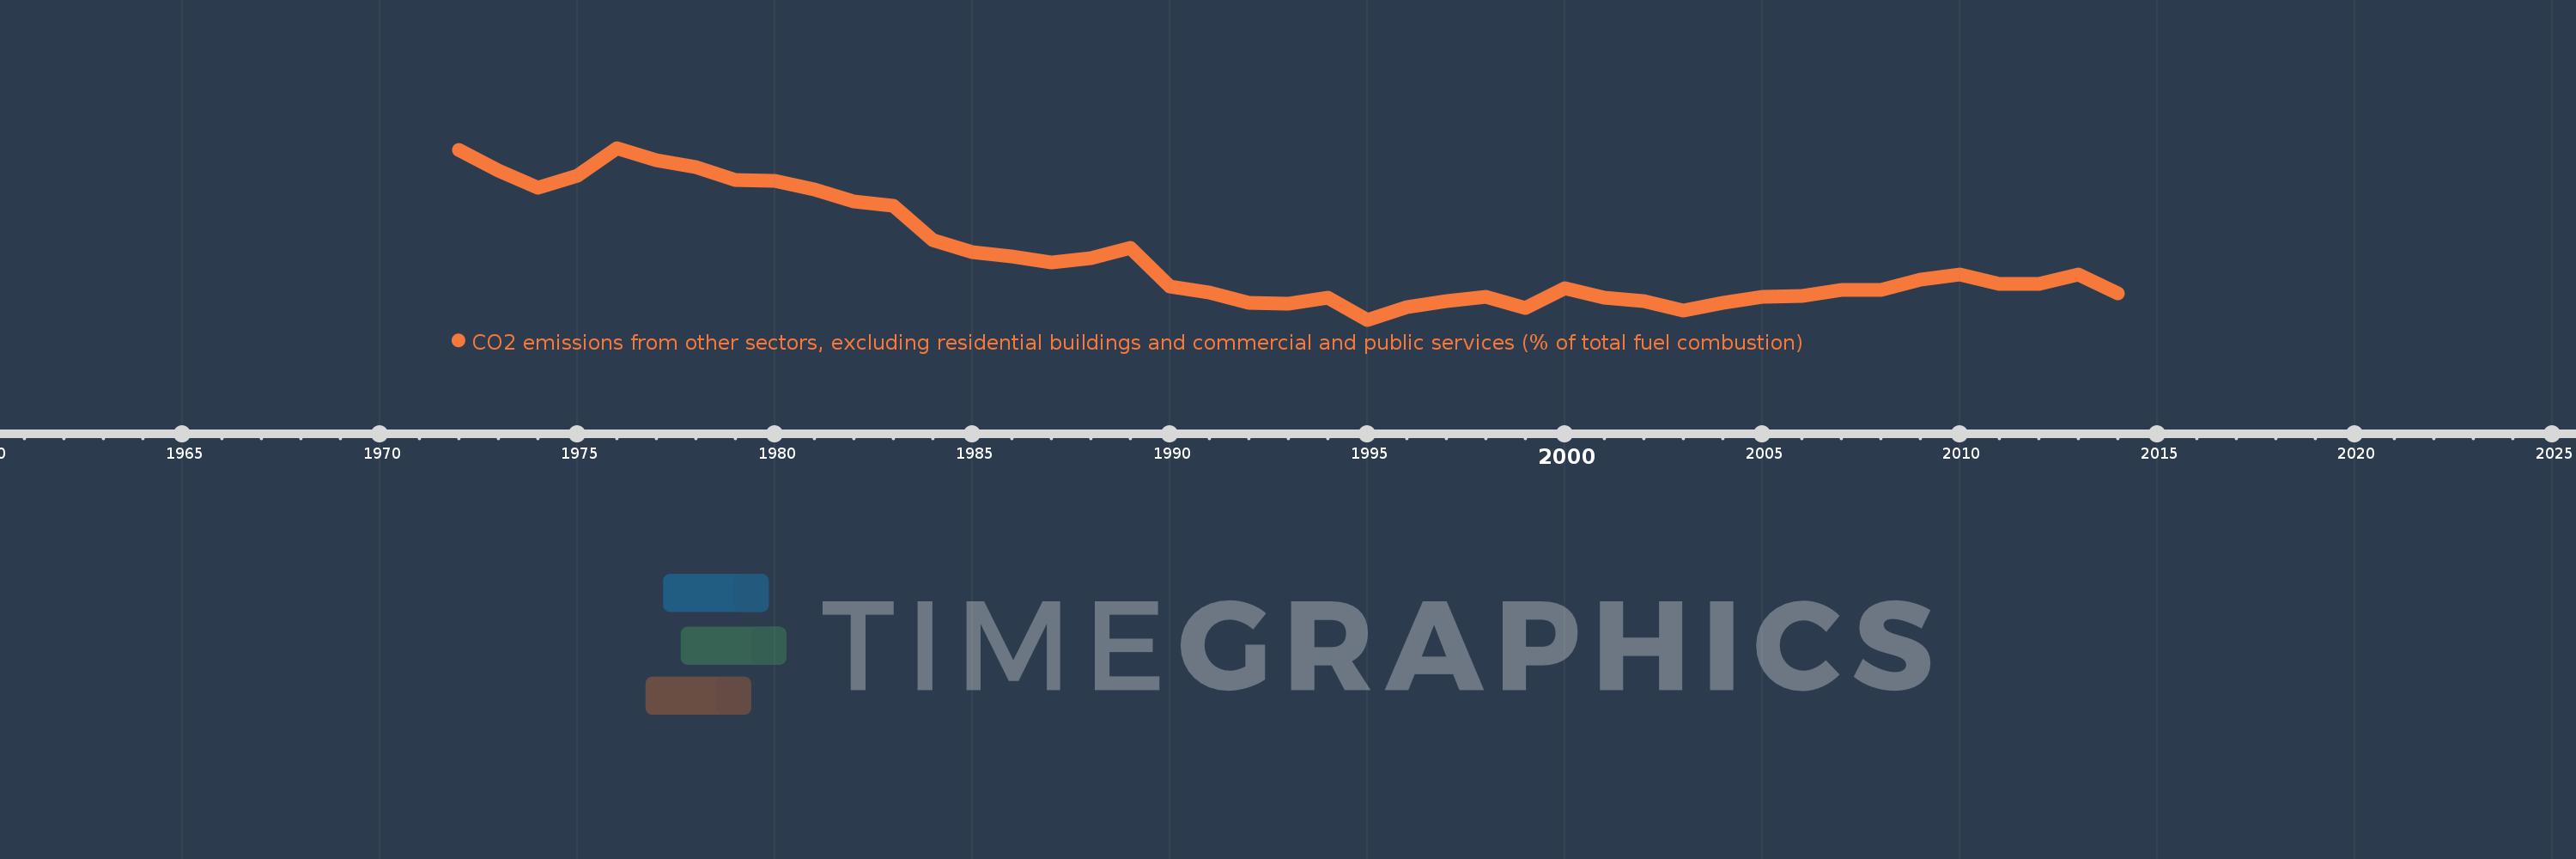
CO2 emissions from other sectors, excluding residential buildings and commercial and public services (% of total fuel combustion)
2014,2013,2012,2011,2010,2009,2008,2007,2006,2005,2004,2003,2002,2001,2000,1999,1998,1997,1996,1995,1994,1993,1992,1991,1990,1989,1988,1987,1986,1985,1984,1983,1982,1981,1980,1979,1978,1977,1976,1975,1974,1973,1972
Estas estatísticas em outros países:
AlbaniaAlgeriaAngolaArab WorldArgentinaArmeniaAustraliaAustriaAzerbaijanBahrainBangladeshBelarusBelgiumBeninBoliviaBosnia and HerzegovinaBotswanaBrazilBrunei DarussalamBulgariaCambodiaCameroonCanadaCaribbean small statesCentral Europe and the BalticsChileChinaColombiaCongo, Dem. Rep.Congo, Rep.Costa RicaCote d'IvoireCroatiaCubaCuracaoCyprusCzech RepublicDenmarkDominican RepublicEarly-demographic dividendEast Asia & PacificEast Asia & Pacific (excluding high income)East Asia & Pacific (IDA & IBRD countries)EcuadorEgypt, Arab Rep.El SalvadorEritreaEstoniaEthiopiaEuro areaEurope & Central AsiaEurope & Central Asia (excluding high income)Europe & Central Asia (IDA & IBRD countries)European UnionFinlandFragile and conflict affected situationsFranceGabonGeorgiaGermanyGhanaGibraltarGreeceGuatemalaHaitiHeavily indebted poor countries (HIPC)High incomeHondurasHong Kong SAR, ChinaHungaryIBRD onlyIcelandIDA & IBRD totalIDA blendIDA onlyIDA totalIndiaIndonesiaIran, Islamic Rep.IraqIrelandIsraelItalyJamaicaJapanJordanKazakhstanKenyaKorea, Dem. People’s Rep.Korea, Rep.KosovoKuwaitKyrgyz RepublicLate-demographic dividendLatin America & Caribbean Latin America & Caribbean (excluding high income)Latin America & the Caribbean (IDA & IBRD countries)LatviaLeast developed countries: UN classificationLebanonLibyaLithuaniaLow & middle incomeLow incomeLower middle incomeLuxembourgMacedonia, FYRMalaysiaMaltaMauritiusMexicoMiddle East & North AfricaMiddle East & North Africa (excluding high income)Middle East & North Africa (IDA & IBRD countries)Middle incomeMoldovaMongoliaMontenegroMoroccoMozambiqueMyanmarNamibiaNepalNetherlandsNew ZealandNicaraguaNigerNigeriaNorth AmericaNorwayOECD membersOmanOther small statesPakistanPanamaParaguayPeruPhilippinesPolandPortugalPost-demographic dividendPre-demographic dividendQatarRomaniaRussian FederationSaudi ArabiaSenegalSerbiaSingaporeSlovak RepublicSloveniaSmall statesSouth AfricaSouth AsiaSouth Asia (IDA & IBRD)South SudanSpainSri LankaSub-Saharan Africa Sub-Saharan Africa (excluding high income)Sub-Saharan Africa (IDA & IBRD countries)SudanSwedenSwitzerlandSyrian Arab RepublicTajikistanTanzaniaThailandTogoTrinidad and TobagoTunisiaTurkeyTurkmenistanUkraineUnited Arab EmiratesUnited KingdomUnited StatesUpper middle incomeUruguayUzbekistanVenezuela, RBVietnamWorldYemen, Rep.ZambiaZimbabwe Linha do tempo:
Nesta escala de tempo está apresentado um gráfico de 1972 ano até 2014 ano Mexico. Dados de 1971 ano ausente. O número de observações reais por data: 43.
Fonte (nome):
Indicadores de desenvolvimento mundial
Fonte (organização):
IEA Statistics © OECD/IEA 2014 (http://www.iea.org/stats/index.asp), subject to https://www.iea.org/t&c/termsandconditions/
Categorias:
Environment
Foi atualizado:
23 abr 2017 ano
Indicadores de alterações dos valores ao longo dos anos
Mínimo:
1.693
1 jan 1995 ano
Máximo:
3.509
1 jan 1976 ano
Na data de observação
Valor
Mudança absoluta
A alteração em relação ao valor anterior
1 jan 1972 ano
3.489
+3.489
0.0%
1 jan 1973 ano
3.27
-0.219
-6.28%
1 jan 1974 ano
3.087
-0.183
-5.61%
1 jan 1975 ano
3.212
+0.126
4.07%
1 jan 1976 ano
3.509
+0.296
9.22%
1 jan 1977 ano
3.376
-0.133
-3.8%
1 jan 1978 ano
3.306
-0.069
-2.06%
1 jan 1979 ano
3.174
-0.132
-4.01%
1 jan 1980 ano
3.162
-0.012
-0.38%
1 jan 1981 ano
3.07
-0.091
-2.89%
1 jan 1982 ano
2.939
-0.131
-4.28%
1 jan 1983 ano
2.896
-0.043
-1.45%
1 jan 1984 ano
2.538
-0.358
-12.36%
1 jan 1985 ano
2.412
-0.126
-4.98%
1 jan 1986 ano
2.36
-0.052
-2.14%
1 jan 1987 ano
2.298
-0.063
-2.65%
1 jan 1988 ano
2.346
+0.048
2.09%
1 jan 1989 ano
2.453
+0.108
4.58%
1 jan 1990 ano
2.046
-0.407
-16.6%
1 jan 1991 ano
1.977
-0.069
-3.38%
1 jan 1992 ano
1.869
-0.107
-5.44%
1 jan 1993 ano
1.864
-0.005
-0.28%
1 jan 1994 ano
1.926
+0.062
3.31%
1 jan 1995 ano
1.693
-0.233
-12.08%
1 jan 1996 ano
1.831
+0.138
8.13%
1 jan 1997 ano
1.891
+0.06
3.3%
1 jan 1998 ano
1.937
+0.045
2.39%
1 jan 1999 ano
1.815
-0.121
-6.27%
1 jan 2000 ano
2.027
+0.211
11.65%
1 jan 2001 ano
1.922
-0.105
-5.18%
1 jan 2002 ano
1.891
-0.03
-1.57%
1 jan 2003 ano
1.787
-0.105
-5.53%
1 jan 2004 ano
1.869
+0.083
4.62%
1 jan 2005 ano
1.931
+0.061
3.27%
1 jan 2006 ano
1.949
+0.018
0.95%
1 jan 2007 ano
2.007
+0.058
2.99%
1 jan 2008 ano
2.004
-0.004
-0.18%
1 jan 2009 ano
2.113
+0.11
5.48%
1 jan 2010 ano
2.175
+0.061
2.9%
1 jan 2011 ano
2.07
-0.104
-4.8%
1 jan 2012 ano
2.069
-0.001
-0.07%
1 jan 2013 ano
2.17
+0.101
4.88%
1 jan 2014 ano
1.974
-0.195
-9.0%
Classificação de países por estatísticas atuais por anos


Comentários: