29
/pt/
pt
AIzaSyAYiBZKx7MnpbEhh9jyipgxe19OcubqV5w
April 1, 2024
54622
Post-demographic dividend
PST
false
2
1
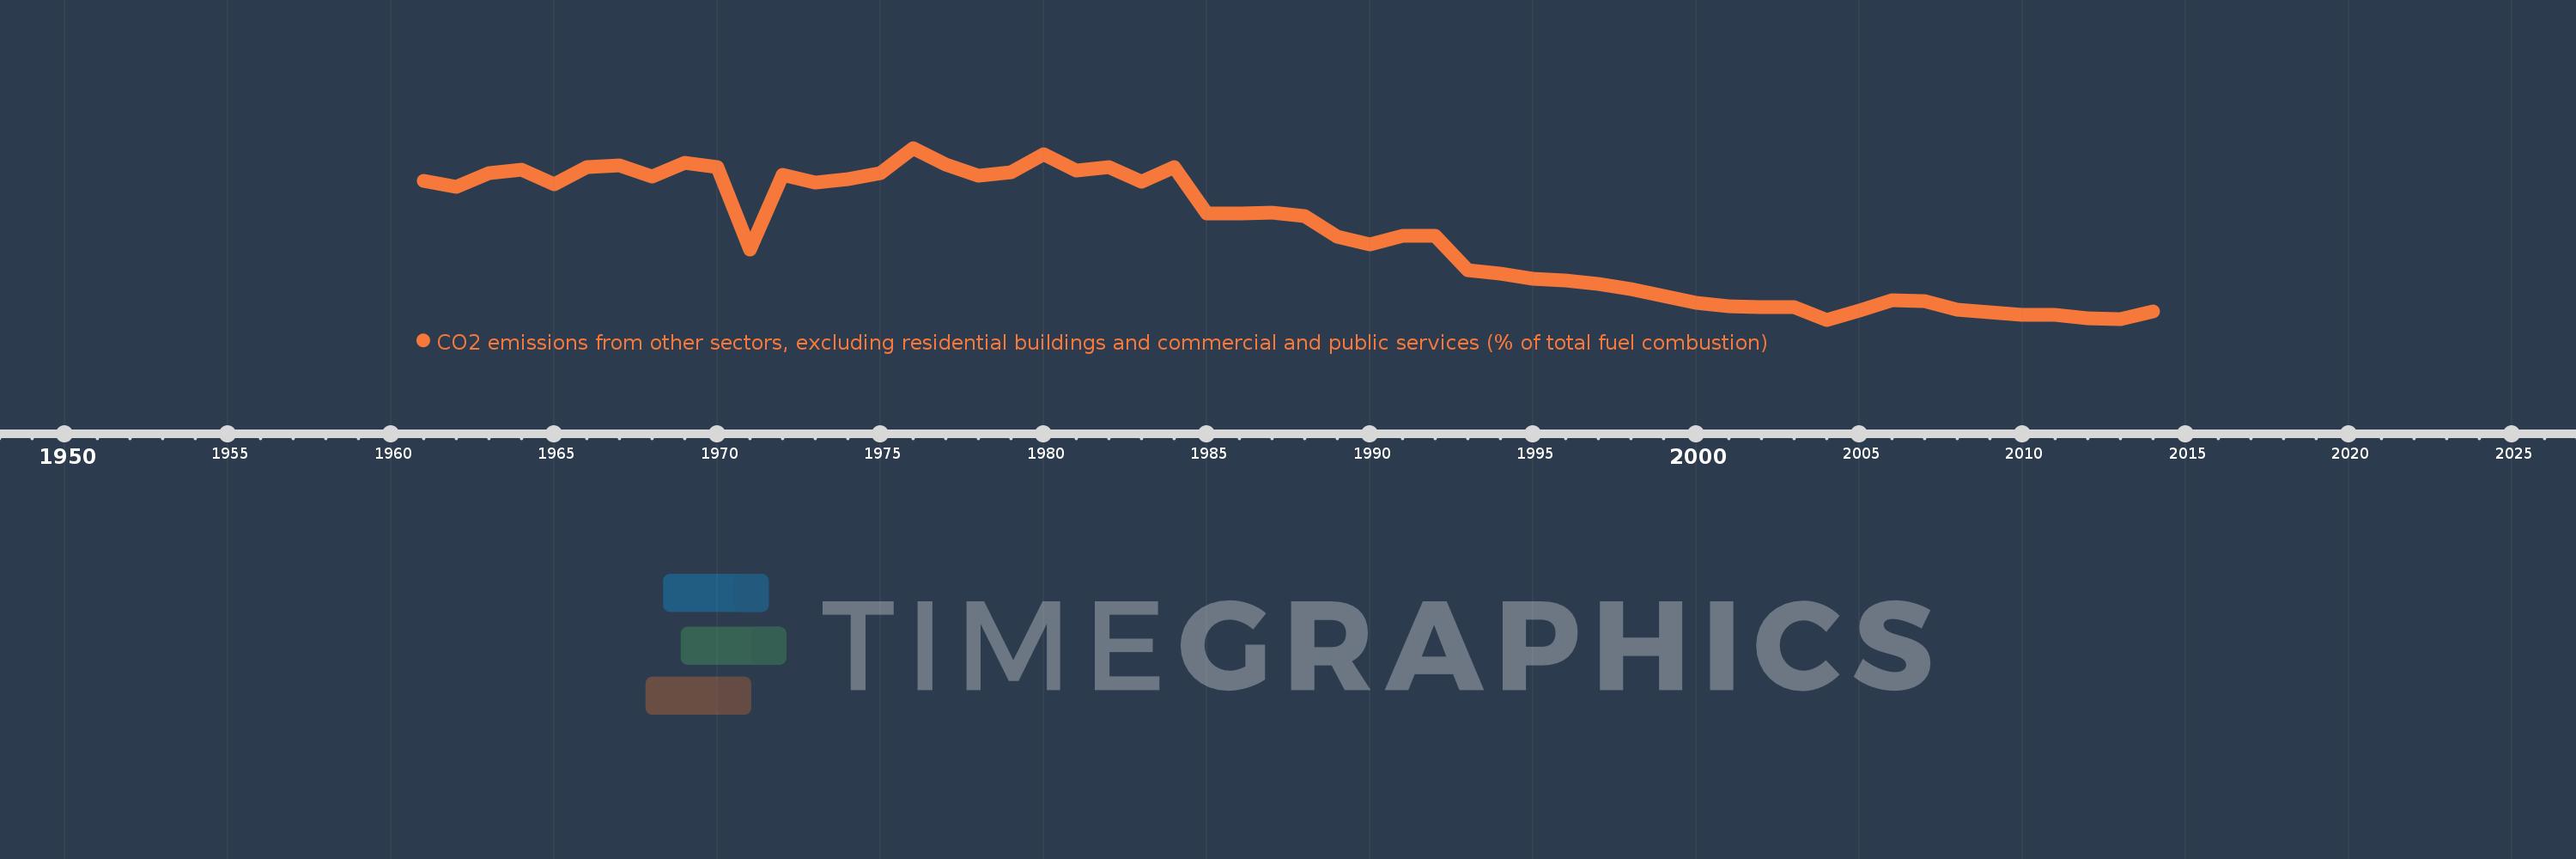
CO2 emissions from other sectors, excluding residential buildings and commercial and public services (% of total fuel combustion)
2014,2013,2012,2011,2010,2009,2008,2007,2006,2005,2004,2003,2002,2001,2000,1999,1998,1997,1996,1995,1994,1993,1992,1991,1990,1989,1988,1987,1986,1985,1984,1983,1982,1981,1980,1979,1978,1977,1976,1975,1974,1973,1972,1971,1970,1969,1968,1967,1966,1965,1964,1963,1962,1961
Estas estatísticas em outros países:
AlbaniaAlgeriaAngolaArab WorldArgentinaArmeniaAustraliaAustriaAzerbaijanBahrainBangladeshBelarusBelgiumBeninBoliviaBosnia and HerzegovinaBotswanaBrazilBrunei DarussalamBulgariaCambodiaCameroonCanadaCaribbean small statesCentral Europe and the BalticsChileChinaColombiaCongo, Dem. Rep.Congo, Rep.Costa RicaCote d'IvoireCroatiaCubaCuracaoCyprusCzech RepublicDenmarkDominican RepublicEarly-demographic dividendEast Asia & PacificEast Asia & Pacific (excluding high income)East Asia & Pacific (IDA & IBRD countries)EcuadorEgypt, Arab Rep.El SalvadorEritreaEstoniaEthiopiaEuro areaEurope & Central AsiaEurope & Central Asia (excluding high income)Europe & Central Asia (IDA & IBRD countries)European UnionFinlandFragile and conflict affected situationsFranceGabonGeorgiaGermanyGhanaGibraltarGreeceGuatemalaHaitiHeavily indebted poor countries (HIPC)High incomeHondurasHong Kong SAR, ChinaHungaryIBRD onlyIcelandIDA & IBRD totalIDA blendIDA onlyIDA totalIndiaIndonesiaIran, Islamic Rep.IraqIrelandIsraelItalyJamaicaJapanJordanKazakhstanKenyaKorea, Dem. People’s Rep.Korea, Rep.KosovoKuwaitKyrgyz RepublicLate-demographic dividendLatin America & Caribbean Latin America & Caribbean (excluding high income)Latin America & the Caribbean (IDA & IBRD countries)LatviaLeast developed countries: UN classificationLebanonLibyaLithuaniaLow & middle incomeLow incomeLower middle incomeLuxembourgMacedonia, FYRMalaysiaMaltaMauritiusMexicoMiddle East & North AfricaMiddle East & North Africa (excluding high income)Middle East & North Africa (IDA & IBRD countries)Middle incomeMoldovaMongoliaMontenegroMoroccoMozambiqueMyanmarNamibiaNepalNetherlandsNew ZealandNicaraguaNigerNigeriaNorth AmericaNorwayOECD membersOmanOther small statesPakistanPanamaParaguayPeruPhilippinesPolandPortugalPost-demographic dividendPre-demographic dividendQatarRomaniaRussian FederationSaudi ArabiaSenegalSerbiaSingaporeSlovak RepublicSloveniaSmall statesSouth AfricaSouth AsiaSouth Asia (IDA & IBRD)South SudanSpainSri LankaSub-Saharan Africa Sub-Saharan Africa (excluding high income)Sub-Saharan Africa (IDA & IBRD countries)SudanSwedenSwitzerlandSyrian Arab RepublicTajikistanTanzaniaThailandTogoTrinidad and TobagoTunisiaTurkeyTurkmenistanUkraineUnited Arab EmiratesUnited KingdomUnited StatesUpper middle incomeUruguayUzbekistanVenezuela, RBVietnamWorldYemen, Rep.ZambiaZimbabwe Linha do tempo:
Nesta escala de tempo está apresentado um gráfico de 1961 ano até 2014 ano Post-demographic dividend. Dados de 1960 ano ausente. O número de observações reais por data: 54.
Fonte (nome):
Indicadores de desenvolvimento mundial
Fonte (organização):
IEA Statistics © OECD/IEA 2014 (http://www.iea.org/stats/index.asp), subject to https://www.iea.org/t&c/termsandconditions/
Categorias:
Environment
Foi atualizado:
23 abr 2017 ano
Indicadores de alterações dos valores ao longo dos anos
Mínimo:
1.366
1 jan 2004 ano
Máximo:
2.952
1 jan 1976 ano
Na data de observação
Valor
Mudança absoluta
A alteração em relação ao valor anterior
1 jan 1961 ano
2.649
+2.649
0.0%
1 jan 1962 ano
2.589
-0.06
-2.27%
1 jan 1963 ano
2.716
+0.127
4.9%
1 jan 1964 ano
2.755
+0.039
1.45%
1 jan 1965 ano
2.615
-0.14
-5.07%
1 jan 1966 ano
2.777
+0.162
6.19%
1 jan 1967 ano
2.789
+0.012
0.43%
1 jan 1968 ano
2.689
-0.1
-3.58%
1 jan 1969 ano
2.811
+0.122
4.52%
1 jan 1970 ano
2.776
-0.035
-1.25%
1 jan 1971 ano
2.014
-0.762
-27.45%
1 jan 1972 ano
2.702
+0.688
34.16%
1 jan 1973 ano
2.636
-0.065
-2.41%
1 jan 1974 ano
2.663
+0.027
1.01%
1 jan 1975 ano
2.718
+0.055
2.07%
1 jan 1976 ano
2.952
+0.234
8.62%
1 jan 1977 ano
2.796
-0.156
-5.29%
1 jan 1978 ano
2.696
-0.101
-3.6%
1 jan 1979 ano
2.729
+0.034
1.25%
1 jan 1980 ano
2.891
+0.161
5.91%
1 jan 1981 ano
2.745
-0.145
-5.03%
1 jan 1982 ano
2.776
+0.031
1.12%
1 jan 1983 ano
2.638
-0.138
-4.98%
1 jan 1984 ano
2.773
+0.135
5.14%
1 jan 1985 ano
2.343
-0.43
-15.5%
1 jan 1986 ano
2.348
+0.005
0.2%
1 jan 1987 ano
2.358
+0.01
0.41%
1 jan 1988 ano
2.327
-0.031
-1.32%
1 jan 1989 ano
2.131
-0.196
-8.42%
1 jan 1990 ano
2.063
-0.068
-3.19%
1 jan 1991 ano
2.143
+0.08
3.9%
1 jan 1992 ano
2.137
-0.006
-0.29%
1 jan 1993 ano
1.826
-0.311
-14.56%
1 jan 1994 ano
1.794
-0.032
-1.74%
1 jan 1995 ano
1.742
-0.052
-2.91%
1 jan 1996 ano
1.728
-0.013
-0.77%
1 jan 1997 ano
1.697
-0.031
-1.81%
1 jan 1998 ano
1.648
-0.049
-2.87%
1 jan 1999 ano
1.588
-0.06
-3.66%
1 jan 2000 ano
1.521
-0.067
-4.2%
1 jan 2001 ano
1.494
-0.028
-1.81%
1 jan 2002 ano
1.484
-0.009
-0.62%
1 jan 2003 ano
1.485
+0.001
0.04%
1 jan 2004 ano
1.366
-0.119
-7.99%
1 jan 2005 ano
1.451
+0.085
6.19%
1 jan 2006 ano
1.546
+0.095
6.53%
1 jan 2007 ano
1.536
-0.01
-0.64%
1 jan 2008 ano
1.456
-0.08
-5.18%
1 jan 2009 ano
1.433
-0.023
-1.61%
1 jan 2010 ano
1.409
-0.024
-1.66%
1 jan 2011 ano
1.413
+0.004
0.26%
1 jan 2012 ano
1.383
-0.029
-2.07%
1 jan 2013 ano
1.374
-0.009
-0.67%
1 jan 2014 ano
1.445
+0.071
5.14%
Classificação de países por estatísticas atuais por anos


Comentários: