29
/pt/
pt
AIzaSyAYiBZKx7MnpbEhh9jyipgxe19OcubqV5w
April 1, 2024
27934
East Asia & Pacific (excluding high income)
EAP
false
2
1
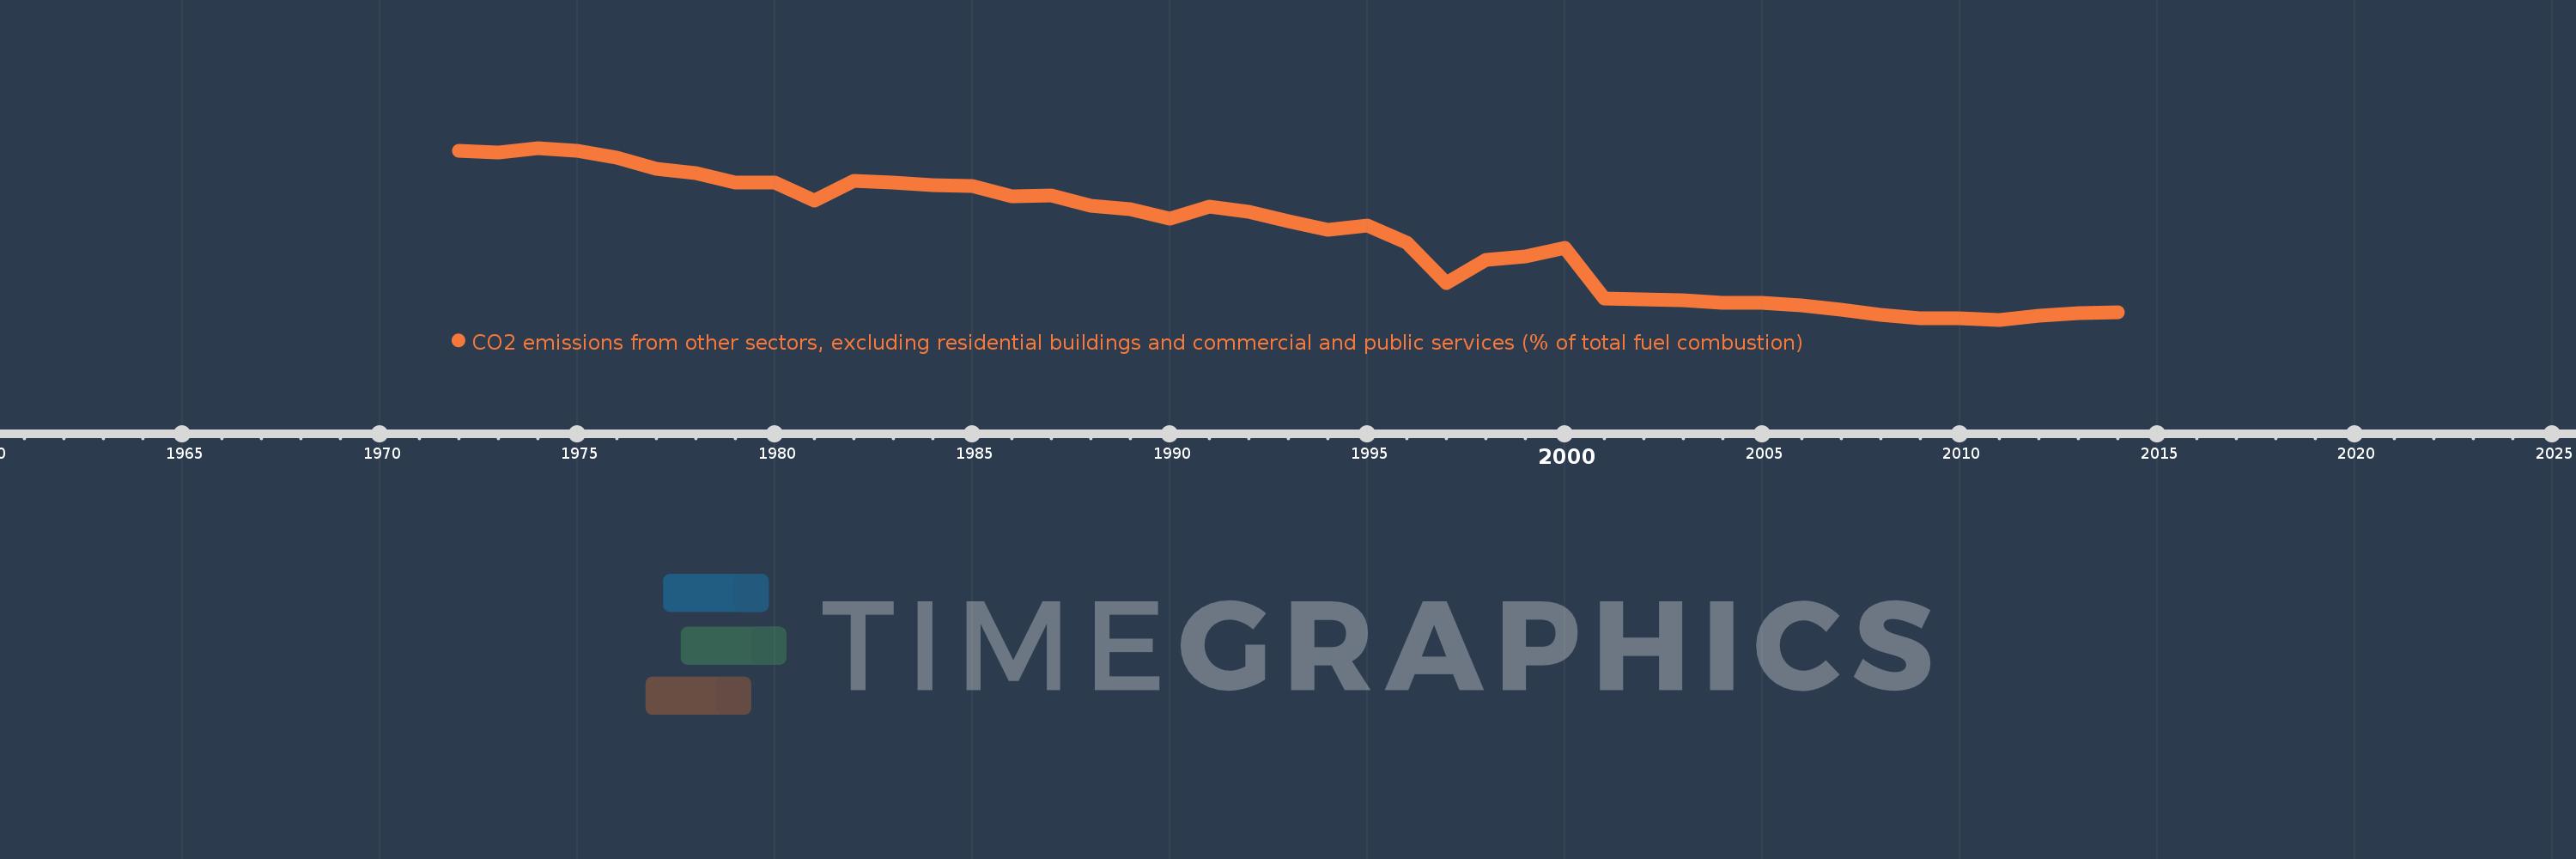
CO2 emissions from other sectors, excluding residential buildings and commercial and public services (% of total fuel combustion)
2014,2013,2012,2011,2010,2009,2008,2007,2006,2005,2004,2003,2002,2001,2000,1999,1998,1997,1996,1995,1994,1993,1992,1991,1990,1989,1988,1987,1986,1985,1984,1983,1982,1981,1980,1979,1978,1977,1976,1975,1974,1973,1972
Estas estatísticas em outros países:
AlbaniaAlgeriaAngolaArab WorldArgentinaArmeniaAustraliaAustriaAzerbaijanBahrainBangladeshBelarusBelgiumBeninBoliviaBosnia and HerzegovinaBotswanaBrazilBrunei DarussalamBulgariaCambodiaCameroonCanadaCaribbean small statesCentral Europe and the BalticsChileChinaColombiaCongo, Dem. Rep.Congo, Rep.Costa RicaCote d'IvoireCroatiaCubaCuracaoCyprusCzech RepublicDenmarkDominican RepublicEarly-demographic dividendEast Asia & PacificEast Asia & Pacific (excluding high income)East Asia & Pacific (IDA & IBRD countries)EcuadorEgypt, Arab Rep.El SalvadorEritreaEstoniaEthiopiaEuro areaEurope & Central AsiaEurope & Central Asia (excluding high income)Europe & Central Asia (IDA & IBRD countries)European UnionFinlandFragile and conflict affected situationsFranceGabonGeorgiaGermanyGhanaGibraltarGreeceGuatemalaHaitiHeavily indebted poor countries (HIPC)High incomeHondurasHong Kong SAR, ChinaHungaryIBRD onlyIcelandIDA & IBRD totalIDA blendIDA onlyIDA totalIndiaIndonesiaIran, Islamic Rep.IraqIrelandIsraelItalyJamaicaJapanJordanKazakhstanKenyaKorea, Dem. People’s Rep.Korea, Rep.KosovoKuwaitKyrgyz RepublicLate-demographic dividendLatin America & Caribbean Latin America & Caribbean (excluding high income)Latin America & the Caribbean (IDA & IBRD countries)LatviaLeast developed countries: UN classificationLebanonLibyaLithuaniaLow & middle incomeLow incomeLower middle incomeLuxembourgMacedonia, FYRMalaysiaMaltaMauritiusMexicoMiddle East & North AfricaMiddle East & North Africa (excluding high income)Middle East & North Africa (IDA & IBRD countries)Middle incomeMoldovaMongoliaMontenegroMoroccoMozambiqueMyanmarNamibiaNepalNetherlandsNew ZealandNicaraguaNigerNigeriaNorth AmericaNorwayOECD membersOmanOther small statesPakistanPanamaParaguayPeruPhilippinesPolandPortugalPost-demographic dividendPre-demographic dividendQatarRomaniaRussian FederationSaudi ArabiaSenegalSerbiaSingaporeSlovak RepublicSloveniaSmall statesSouth AfricaSouth AsiaSouth Asia (IDA & IBRD)South SudanSpainSri LankaSub-Saharan Africa Sub-Saharan Africa (excluding high income)Sub-Saharan Africa (IDA & IBRD countries)SudanSwedenSwitzerlandSyrian Arab RepublicTajikistanTanzaniaThailandTogoTrinidad and TobagoTunisiaTurkeyTurkmenistanUkraineUnited Arab EmiratesUnited KingdomUnited StatesUpper middle incomeUruguayUzbekistanVenezuela, RBVietnamWorldYemen, Rep.ZambiaZimbabwe Linha do tempo:
Nesta escala de tempo está apresentado um gráfico de 1972 ano até 2014 ano East Asia & Pacific (excluding high income). Dados de 1971 ano ausente. O número de observações reais por data: 43.
Fonte (nome):
Indicadores de desenvolvimento mundial
Fonte (organização):
IEA Statistics © OECD/IEA 2014 (http://www.iea.org/stats/index.asp), subject to https://www.iea.org/t&c/termsandconditions/
Categorias:
Environment
Foi atualizado:
23 abr 2017 ano
Indicadores de alterações dos valores ao longo dos anos
Mínimo:
1.96
1 jan 2011 ano
Máximo:
7.903
1 jan 1974 ano
Na data de observação
Valor
Mudança absoluta
A alteração em relação ao valor anterior
1 jan 1972 ano
7.808
+7.808
0.0%
1 jan 1973 ano
7.739
-0.069
-0.89%
1 jan 1974 ano
7.903
+0.164
2.12%
1 jan 1975 ano
7.81
-0.093
-1.17%
1 jan 1976 ano
7.57
-0.24
-3.08%
1 jan 1977 ano
7.168
-0.402
-5.31%
1 jan 1978 ano
7.023
-0.145
-2.02%
1 jan 1979 ano
6.702
-0.322
-4.58%
1 jan 1980 ano
6.72
+0.018
0.27%
1 jan 1981 ano
6.077
-0.642
-9.56%
1 jan 1982 ano
6.756
+0.679
11.17%
1 jan 1983 ano
6.698
-0.058
-0.86%
1 jan 1984 ano
6.626
-0.072
-1.08%
1 jan 1985 ano
6.583
-0.042
-0.64%
1 jan 1986 ano
6.221
-0.362
-5.5%
1 jan 1987 ano
6.258
+0.037
0.59%
1 jan 1988 ano
5.911
-0.346
-5.54%
1 jan 1989 ano
5.773
-0.139
-2.34%
1 jan 1990 ano
5.445
-0.328
-5.68%
1 jan 1991 ano
5.879
+0.434
7.97%
1 jan 1992 ano
5.688
-0.191
-3.25%
1 jan 1993 ano
5.361
-0.327
-5.75%
1 jan 1994 ano
5.08
-0.281
-5.24%
1 jan 1995 ano
5.221
+0.141
2.77%
1 jan 1996 ano
4.638
-0.583
-11.16%
1 jan 1997 ano
3.225
-1.414
-30.48%
1 jan 1998 ano
4.036
+0.812
25.17%
1 jan 1999 ano
4.149
+0.113
2.79%
1 jan 2000 ano
4.439
+0.29
6.98%
1 jan 2001 ano
2.701
-1.737
-39.14%
1 jan 2002 ano
2.678
-0.023
-0.86%
1 jan 2003 ano
2.64
-0.038
-1.41%
1 jan 2004 ano
2.549
-0.091
-3.46%
1 jan 2005 ano
2.542
-0.007
-0.28%
1 jan 2006 ano
2.451
-0.091
-3.59%
1 jan 2007 ano
2.306
-0.145
-5.92%
1 jan 2008 ano
2.133
-0.173
-7.5%
1 jan 2009 ano
1.997
-0.136
-6.35%
1 jan 2010 ano
2.0
+0.002
0.12%
1 jan 2011 ano
1.96
-0.04
-2.0%
1 jan 2012 ano
2.111
+0.151
7.72%
1 jan 2013 ano
2.194
+0.083
3.93%
1 jan 2014 ano
2.214
+0.02
0.92%
Classificação de países por estatísticas atuais por anos


Comentários: