29
/pt/
pt
AIzaSyAYiBZKx7MnpbEhh9jyipgxe19OcubqV5w
April 1, 2024
159219
Ireland
IRL
true
2
1
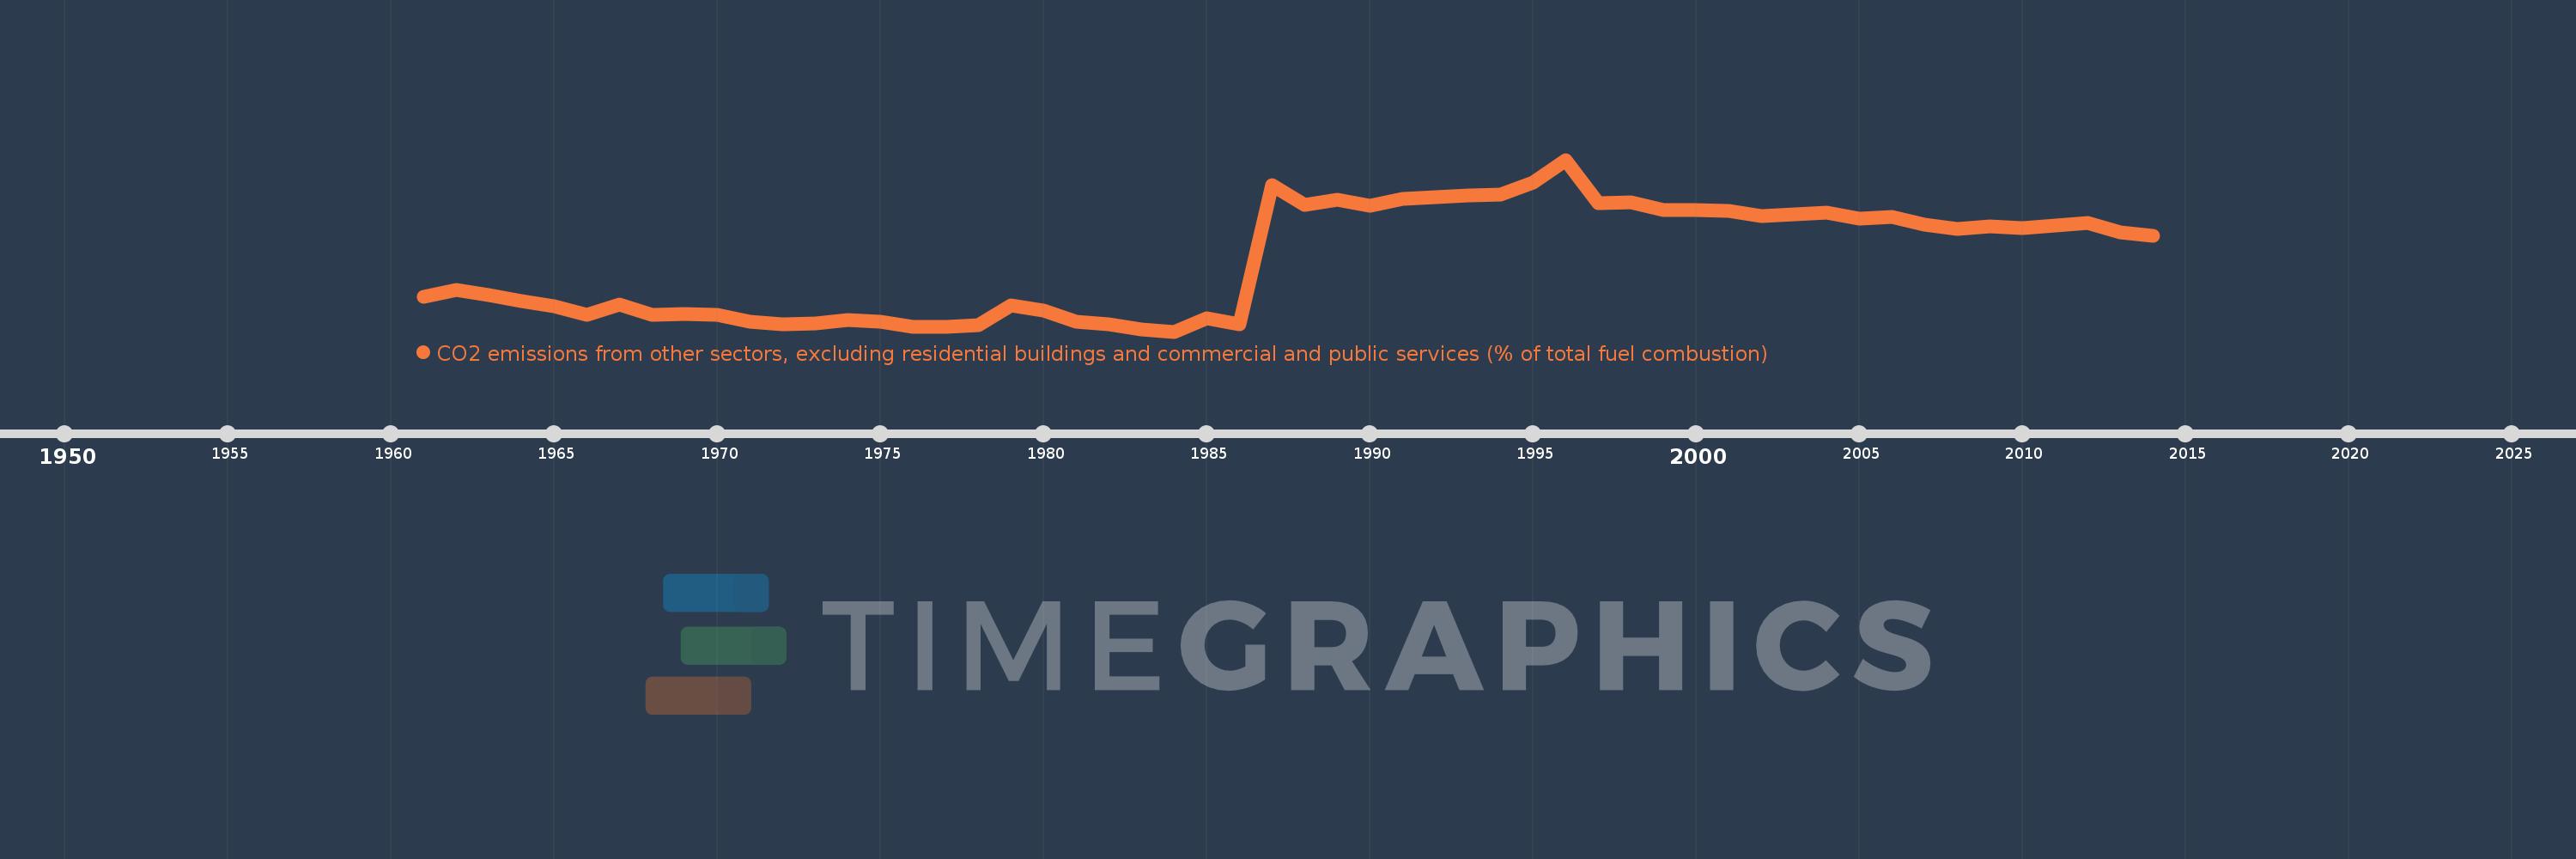
CO2 emissions from other sectors, excluding residential buildings and commercial and public services (% of total fuel combustion)
2014,2013,2012,2011,2010,2009,2008,2007,2006,2005,2004,2003,2002,2001,2000,1999,1998,1997,1996,1995,1994,1993,1992,1991,1990,1989,1988,1987,1986,1985,1984,1983,1982,1981,1980,1979,1978,1977,1976,1975,1974,1973,1972,1971,1970,1969,1968,1967,1966,1965,1964,1963,1962,1961
Estas estatísticas em outros países:
AlbaniaAlgeriaAngolaArab WorldArgentinaArmeniaAustraliaAustriaAzerbaijanBahrainBangladeshBelarusBelgiumBeninBoliviaBosnia and HerzegovinaBotswanaBrazilBrunei DarussalamBulgariaCambodiaCameroonCanadaCaribbean small statesCentral Europe and the BalticsChileChinaColombiaCongo, Dem. Rep.Congo, Rep.Costa RicaCote d'IvoireCroatiaCubaCuracaoCyprusCzech RepublicDenmarkDominican RepublicEarly-demographic dividendEast Asia & PacificEast Asia & Pacific (excluding high income)East Asia & Pacific (IDA & IBRD countries)EcuadorEgypt, Arab Rep.El SalvadorEritreaEstoniaEthiopiaEuro areaEurope & Central AsiaEurope & Central Asia (excluding high income)Europe & Central Asia (IDA & IBRD countries)European UnionFinlandFragile and conflict affected situationsFranceGabonGeorgiaGermanyGhanaGibraltarGreeceGuatemalaHaitiHeavily indebted poor countries (HIPC)High incomeHondurasHong Kong SAR, ChinaHungaryIBRD onlyIcelandIDA & IBRD totalIDA blendIDA onlyIDA totalIndiaIndonesiaIran, Islamic Rep.IraqIrelandIsraelItalyJamaicaJapanJordanKazakhstanKenyaKorea, Dem. People’s Rep.Korea, Rep.KosovoKuwaitKyrgyz RepublicLate-demographic dividendLatin America & Caribbean Latin America & Caribbean (excluding high income)Latin America & the Caribbean (IDA & IBRD countries)LatviaLeast developed countries: UN classificationLebanonLibyaLithuaniaLow & middle incomeLow incomeLower middle incomeLuxembourgMacedonia, FYRMalaysiaMaltaMauritiusMexicoMiddle East & North AfricaMiddle East & North Africa (excluding high income)Middle East & North Africa (IDA & IBRD countries)Middle incomeMoldovaMongoliaMontenegroMoroccoMozambiqueMyanmarNamibiaNepalNetherlandsNew ZealandNicaraguaNigerNigeriaNorth AmericaNorwayOECD membersOmanOther small statesPakistanPanamaParaguayPeruPhilippinesPolandPortugalPost-demographic dividendPre-demographic dividendQatarRomaniaRussian FederationSaudi ArabiaSenegalSerbiaSingaporeSlovak RepublicSloveniaSmall statesSouth AfricaSouth AsiaSouth Asia (IDA & IBRD)South SudanSpainSri LankaSub-Saharan Africa Sub-Saharan Africa (excluding high income)Sub-Saharan Africa (IDA & IBRD countries)SudanSwedenSwitzerlandSyrian Arab RepublicTajikistanTanzaniaThailandTogoTrinidad and TobagoTunisiaTurkeyTurkmenistanUkraineUnited Arab EmiratesUnited KingdomUnited StatesUpper middle incomeUruguayUzbekistanVenezuela, RBVietnamWorldYemen, Rep.ZambiaZimbabwe Linha do tempo:
Nesta escala de tempo está apresentado um gráfico de 1961 ano até 2014 ano Ireland. Dados de 1960 ano ausente. O número de observações reais por data: 54.
Fonte (nome):
Indicadores de desenvolvimento mundial
Fonte (organização):
IEA Statistics © OECD/IEA 2014 (http://www.iea.org/stats/index.asp), subject to https://www.iea.org/t&c/termsandconditions/
Categorias:
Environment
Foi atualizado:
23 abr 2017 ano
Indicadores de alterações dos valores ao longo dos anos
Mínimo:
0.159
1 jan 1984 ano
Máximo:
2.789
1 jan 1996 ano
Na data de observação
Valor
Mudança absoluta
A alteração em relação ao valor anterior
1 jan 1961 ano
0.69
+0.69
0.0%
1 jan 1962 ano
0.798
+0.108
15.66%
1 jan 1963 ano
0.719
-0.078
-9.81%
1 jan 1964 ano
0.629
-0.09
-12.58%
1 jan 1965 ano
0.541
-0.088
-14.05%
1 jan 1966 ano
0.42
-0.12
-22.27%
1 jan 1967 ano
0.573
+0.153
36.43%
1 jan 1968 ano
0.412
-0.161
-28.04%
1 jan 1969 ano
0.429
+0.017
4.1%
1 jan 1970 ano
0.413
-0.017
-3.87%
1 jan 1971 ano
0.307
-0.106
-25.69%
1 jan 1972 ano
0.277
-0.029
-9.61%
1 jan 1973 ano
0.281
+0.003
1.17%
1 jan 1974 ano
0.336
+0.056
19.86%
1 jan 1975 ano
0.31
-0.026
-7.84%
1 jan 1976 ano
0.237
-0.073
-23.67%
1 jan 1977 ano
0.229
-0.008
-3.34%
1 jan 1978 ano
0.256
+0.027
11.77%
1 jan 1979 ano
0.56
+0.305
119.28%
1 jan 1980 ano
0.481
-0.08
-14.2%
1 jan 1981 ano
0.309
-0.172
-35.73%
1 jan 1982 ano
0.272
-0.037
-11.82%
1 jan 1983 ano
0.198
-0.075
-27.38%
1 jan 1984 ano
0.159
-0.039
-19.52%
1 jan 1985 ano
0.361
+0.202
126.99%
1 jan 1986 ano
0.265
-0.097
-26.78%
1 jan 1987 ano
2.403
+2.139
808.18%
1 jan 1988 ano
2.096
-0.307
-12.78%
1 jan 1989 ano
2.171
+0.075
3.56%
1 jan 1990 ano
2.087
-0.084
-3.87%
1 jan 1991 ano
2.192
+0.105
5.03%
1 jan 1992 ano
2.214
+0.022
0.98%
1 jan 1993 ano
2.238
+0.025
1.11%
1 jan 1994 ano
2.259
+0.021
0.93%
1 jan 1995 ano
2.434
+0.176
7.78%
1 jan 1996 ano
2.789
+0.354
14.56%
1 jan 1997 ano
2.119
-0.67
-24.02%
1 jan 1998 ano
2.143
+0.025
1.16%
1 jan 1999 ano
2.021
-0.122
-5.7%
1 jan 2000 ano
2.02
-0.001
-0.04%
1 jan 2001 ano
2.008
-0.012
-0.6%
1 jan 2002 ano
1.932
-0.076
-3.8%
1 jan 2003 ano
1.949
+0.017
0.86%
1 jan 2004 ano
1.978
+0.029
1.48%
1 jan 2005 ano
1.888
-0.09
-4.55%
1 jan 2006 ano
1.921
+0.034
1.78%
1 jan 2007 ano
1.792
-0.13
-6.75%
1 jan 2008 ano
1.732
-0.059
-3.31%
1 jan 2009 ano
1.771
+0.039
2.24%
1 jan 2010 ano
1.748
-0.023
-1.32%
1 jan 2011 ano
1.78
+0.032
1.84%
1 jan 2012 ano
1.817
+0.037
2.1%
1 jan 2013 ano
1.68
-0.137
-7.56%
1 jan 2014 ano
1.63
-0.05
-2.97%
Classificação de países por estatísticas atuais por anos


Comentários: