29
/pt/
pt
AIzaSyAYiBZKx7MnpbEhh9jyipgxe19OcubqV5w
April 1, 2024
73415
Australia
AUS
true
2
1
Rural population growth (annual %)
2016,2015,2014,2013,2012,2011,2010,2009,2008,2007,2006,2005,2004,2003,2002,2001,2000,1999,1998,1997,1996,1995,1994,1993,1992,1991,1990,1989,1988,1987,1986,1985,1984,1983,1982,1981,1980,1979,1978,1977,1976,1975,1974,1973,1972,1971,1970,1969,1968,1967,1966,1965,1964,1963,1962,1961
Estas estatísticas em outros países:
AfghanistanAlbaniaAlgeriaAmerican SamoaAndorraAngolaAntigua and BarbudaArab WorldArgentinaArmeniaArubaAustraliaAustriaAzerbaijanBahamas, TheBahrainBangladeshBarbadosBelarusBelgiumBelizeBeninBhutanBoliviaBosnia and HerzegovinaBotswanaBrazilBritish Virgin IslandsBrunei DarussalamBulgariaBurkina FasoBurundiCabo VerdeCambodiaCameroonCanadaCaribbean small statesCentral African RepublicCentral Europe and the BalticsChadChannel IslandsChileChinaColombiaComorosCongo, Dem. Rep.Congo, Rep.Costa RicaCote d'IvoireCroatiaCubaCuracaoCyprusCzech RepublicDenmarkDjiboutiDominicaDominican RepublicEarly-demographic dividendEast Asia & PacificEast Asia & Pacific (excluding high income)East Asia & Pacific (IDA & IBRD countries)EcuadorEgypt, Arab Rep.El SalvadorEquatorial GuineaEritreaEstoniaEthiopiaEuro areaEurope & Central AsiaEurope & Central Asia (excluding high income)Europe & Central Asia (IDA & IBRD countries)European UnionFaroe IslandsFijiFinlandFragile and conflict affected situationsFranceFrench PolynesiaGabonGambia, TheGeorgiaGermanyGhanaGreeceGreenlandGrenadaGuamGuatemalaGuineaGuinea-BissauGuyanaHaitiHeavily indebted poor countries (HIPC)High incomeHondurasHong Kong SAR, ChinaHungaryIBRD onlyIcelandIDA & IBRD totalIDA blendIDA onlyIDA totalIndiaIndonesiaIran, Islamic Rep.IraqIrelandIsle of ManIsraelItalyJamaicaJapanJordanKazakhstanKenyaKiribatiKorea, Dem. People’s Rep.Korea, Rep.KuwaitKyrgyz RepublicLao PDRLate-demographic dividendLatin America & Caribbean Latin America & Caribbean (excluding high income)Latin America & the Caribbean (IDA & IBRD countries)LatviaLeast developed countries: UN classificationLebanonLesothoLiberiaLibyaLiechtensteinLithuaniaLow & middle incomeLow incomeLower middle incomeLuxembourgMacao SAR, ChinaMacedonia, FYRMadagascarMalawiMalaysiaMaldivesMaliMaltaMarshall IslandsMauritaniaMauritiusMexicoMicronesia, Fed. Sts.Middle East & North AfricaMiddle East & North Africa (excluding high income)Middle East & North Africa (IDA & IBRD countries)Middle incomeMoldovaMongoliaMontenegroMoroccoMozambiqueMyanmarNamibiaNauruNepalNetherlandsNew CaledoniaNew ZealandNicaraguaNigerNigeriaNorth AmericaNorthern Mariana IslandsNorwayOECD membersOmanOther small statesPacific island small statesPakistanPalauPanamaPapua New GuineaParaguayPeruPhilippinesPolandPortugalPost-demographic dividendPre-demographic dividendPuerto RicoQatarRomaniaRussian FederationRwandaSamoaSan MarinoSao Tome and PrincipeSaudi ArabiaSenegalSerbiaSeychellesSierra LeoneSlovak RepublicSloveniaSmall statesSolomon IslandsSomaliaSouth AfricaSouth AsiaSouth Asia (IDA & IBRD)South SudanSpainSri LankaSt. Kitts and NevisSt. LuciaSt. Vincent and the GrenadinesSub-Saharan Africa Sub-Saharan Africa (excluding high income)Sub-Saharan Africa (IDA & IBRD countries)SudanSurinameSwazilandSwedenSwitzerlandSyrian Arab RepublicTajikistanTanzaniaThailandTimor-LesteTogoTongaTrinidad and TobagoTunisiaTurkeyTurkmenistanTurks and Caicos IslandsTuvaluUgandaUkraineUnited Arab EmiratesUnited KingdomUnited StatesUpper middle incomeUruguayUzbekistanVanuatuVenezuela, RBVietnamVirgin Islands (U.S.)West Bank and GazaWorldYemen, Rep.ZambiaZimbabwe Linha do tempo:
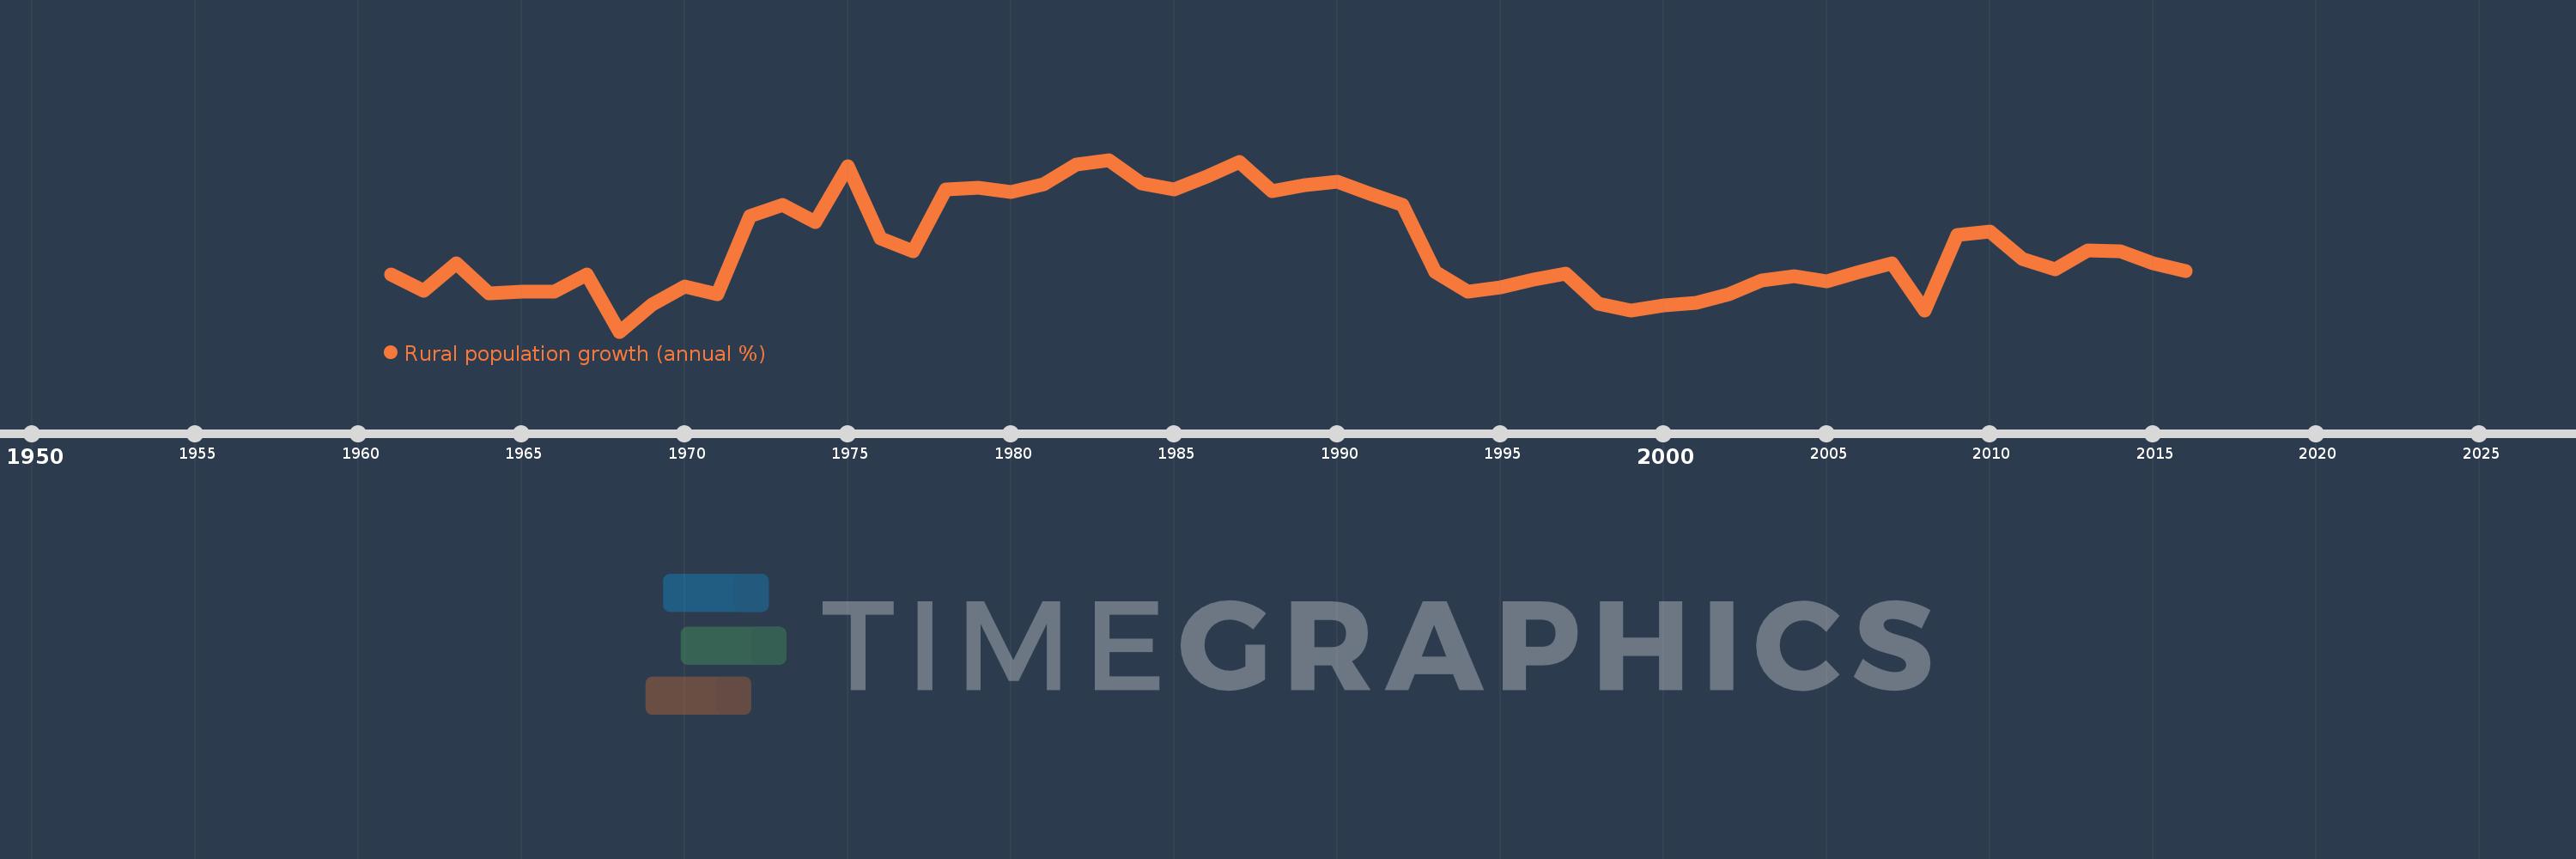
Nesta escala de tempo está apresentado um gráfico de 1961 ano até 2016 ano Australia. Dados de 1960 ano ausente. O número de observações reais por data: 56.
Fonte (nome):
Indicadores de desenvolvimento mundial
Fonte (organização):
World Bank Staff estimates based on United Nations, World Urbanization Prospects.
Categorias:
Agriculture & Rural Development
Foi atualizado:
23 abr 2017 ano
Indicadores de alterações dos valores ao longo dos anos
Mínimo:
-1.005
1 jan 1968 ano
Máximo:
2.086
1 jan 1983 ano
Na data de observação
Valor
Mudança absoluta
A alteração em relação ao valor anterior
1 jan 1961 ano
0.019
+0.019
0.0%
1 jan 1962 ano
-0.266
-0.285
-1.53 mil%
1 jan 1963 ano
0.223
+0.489
-183.98%
1 jan 1964 ano
-0.315
-0.538
-240.97%
1 jan 1965 ano
-0.28
+0.035
-11.12%
1 jan 1966 ano
-0.286
-0.006
2.01%
1 jan 1967 ano
0.017
+0.303
-106.07%
1 jan 1968 ano
-1.005
-1.023
-5.9 mil%
1 jan 1969 ano
-0.517
+0.488
-48.55%
1 jan 1970 ano
-0.195
+0.322
-62.26%
1 jan 1971 ano
-0.331
-0.136
69.53%
1 jan 1972 ano
1.081
+1.412
-426.52%
1 jan 1973 ano
1.274
+0.194
17.91%
1 jan 1974 ano
0.969
-0.306
-23.98%
1 jan 1975 ano
1.968
+0.999
103.18%
1 jan 1976 ano
0.665
-1.303
-66.23%
1 jan 1977 ano
0.44
-0.225
-33.79%
1 jan 1978 ano
1.554
+1.114
253.27%
1 jan 1979 ano
1.582
+0.027
1.76%
1 jan 1980 ano
1.505
-0.077
-4.87%
1 jan 1981 ano
1.648
+0.144
9.54%
1 jan 1982 ano
2.007
+0.359
21.78%
1 jan 1983 ano
2.086
+0.079
3.93%
1 jan 1984 ano
1.668
-0.419
-20.07%
1 jan 1985 ano
1.547
-0.12
-7.2%
1 jan 1986 ano
1.781
+0.233
15.08%
1 jan 1987 ano
2.051
+0.27
15.16%
1 jan 1988 ano
1.521
-0.53
-25.83%
1 jan 1989 ano
1.636
+0.115
7.58%
1 jan 1990 ano
1.693
+0.056
3.44%
1 jan 1991 ano
1.48
-0.213
-12.56%
1 jan 1992 ano
1.275
-0.205
-13.88%
1 jan 1993 ano
0.07
-1.205
-94.52%
1 jan 1994 ano
-0.291
-0.36
-515.82%
1 jan 1995 ano
-0.213
+0.078
-26.87%
1 jan 1996 ano
-0.065
+0.148
-69.42%
1 jan 1997 ano
0.032
+0.097
-148.78%
1 jan 1998 ano
-0.506
-0.537
-1.69 mil%
1 jan 1999 ano
-0.624
-0.118
23.41%
1 jan 2000 ano
-0.529
+0.095
-15.23%
1 jan 2001 ano
-0.492
+0.037
-6.98%
1 jan 2002 ano
-0.325
+0.167
-33.91%
1 jan 2003 ano
-0.079
+0.246
-75.62%
1 jan 2004 ano
-0.01
+0.069
-87.68%
1 jan 2005 ano
-0.1
-0.09
925.25%
1 jan 2006 ano
0.069
+0.169
-169.26%
1 jan 2007 ano
0.217
+0.148
213.52%
1 jan 2008 ano
-0.632
-0.849
-390.84%
1 jan 2009 ano
0.74
+1.372
-217.04%
1 jan 2010 ano
0.798
+0.058
7.89%
1 jan 2011 ano
0.294
-0.504
-63.14%
1 jan 2012 ano
0.121
-0.173
-58.81%
1 jan 2013 ano
0.456
+0.335
276.56%
1 jan 2014 ano
0.433
-0.023
-5.09%
1 jan 2015 ano
0.227
-0.206
-47.6%
1 jan 2016 ano
0.083
-0.144
-63.28%
Classificação de países por estatísticas atuais por anos


Comentários: