29
/pt/
pt
AIzaSyAYiBZKx7MnpbEhh9jyipgxe19OcubqV5w
April 1, 2024
224276
Philippines
PHL
true
2
1
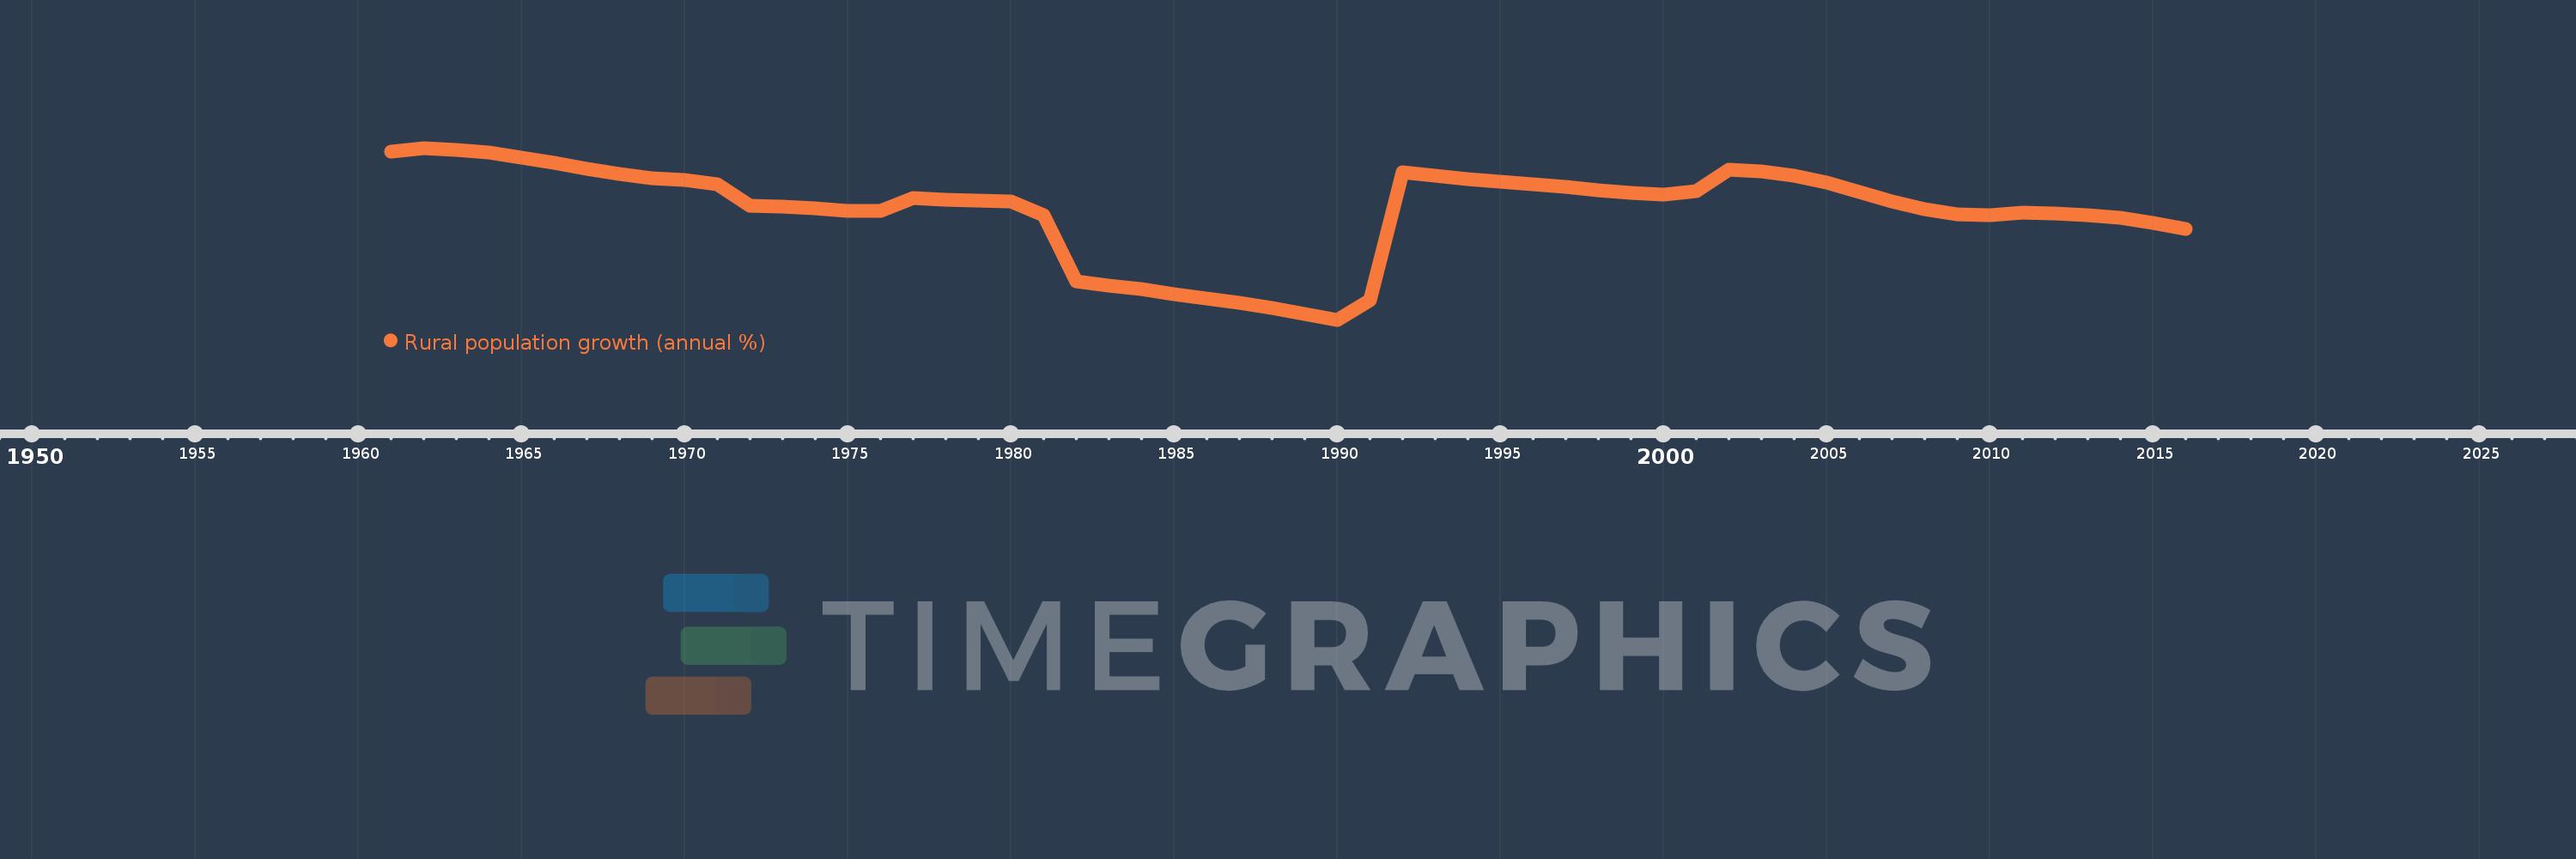
Rural population growth (annual %)
2016,2015,2014,2013,2012,2011,2010,2009,2008,2007,2006,2005,2004,2003,2002,2001,2000,1999,1998,1997,1996,1995,1994,1993,1992,1991,1990,1989,1988,1987,1986,1985,1984,1983,1982,1981,1980,1979,1978,1977,1976,1975,1974,1973,1972,1971,1970,1969,1968,1967,1966,1965,1964,1963,1962,1961
Estas estatísticas em outros países:
AfghanistanAlbaniaAlgeriaAmerican SamoaAndorraAngolaAntigua and BarbudaArab WorldArgentinaArmeniaArubaAustraliaAustriaAzerbaijanBahamas, TheBahrainBangladeshBarbadosBelarusBelgiumBelizeBeninBhutanBoliviaBosnia and HerzegovinaBotswanaBrazilBritish Virgin IslandsBrunei DarussalamBulgariaBurkina FasoBurundiCabo VerdeCambodiaCameroonCanadaCaribbean small statesCentral African RepublicCentral Europe and the BalticsChadChannel IslandsChileChinaColombiaComorosCongo, Dem. Rep.Congo, Rep.Costa RicaCote d'IvoireCroatiaCubaCuracaoCyprusCzech RepublicDenmarkDjiboutiDominicaDominican RepublicEarly-demographic dividendEast Asia & PacificEast Asia & Pacific (excluding high income)East Asia & Pacific (IDA & IBRD countries)EcuadorEgypt, Arab Rep.El SalvadorEquatorial GuineaEritreaEstoniaEthiopiaEuro areaEurope & Central AsiaEurope & Central Asia (excluding high income)Europe & Central Asia (IDA & IBRD countries)European UnionFaroe IslandsFijiFinlandFragile and conflict affected situationsFranceFrench PolynesiaGabonGambia, TheGeorgiaGermanyGhanaGreeceGreenlandGrenadaGuamGuatemalaGuineaGuinea-BissauGuyanaHaitiHeavily indebted poor countries (HIPC)High incomeHondurasHong Kong SAR, ChinaHungaryIBRD onlyIcelandIDA & IBRD totalIDA blendIDA onlyIDA totalIndiaIndonesiaIran, Islamic Rep.IraqIrelandIsle of ManIsraelItalyJamaicaJapanJordanKazakhstanKenyaKiribatiKorea, Dem. People’s Rep.Korea, Rep.KuwaitKyrgyz RepublicLao PDRLate-demographic dividendLatin America & Caribbean Latin America & Caribbean (excluding high income)Latin America & the Caribbean (IDA & IBRD countries)LatviaLeast developed countries: UN classificationLebanonLesothoLiberiaLibyaLiechtensteinLithuaniaLow & middle incomeLow incomeLower middle incomeLuxembourgMacao SAR, ChinaMacedonia, FYRMadagascarMalawiMalaysiaMaldivesMaliMaltaMarshall IslandsMauritaniaMauritiusMexicoMicronesia, Fed. Sts.Middle East & North AfricaMiddle East & North Africa (excluding high income)Middle East & North Africa (IDA & IBRD countries)Middle incomeMoldovaMongoliaMontenegroMoroccoMozambiqueMyanmarNamibiaNauruNepalNetherlandsNew CaledoniaNew ZealandNicaraguaNigerNigeriaNorth AmericaNorthern Mariana IslandsNorwayOECD membersOmanOther small statesPacific island small statesPakistanPalauPanamaPapua New GuineaParaguayPeruPhilippinesPolandPortugalPost-demographic dividendPre-demographic dividendPuerto RicoQatarRomaniaRussian FederationRwandaSamoaSan MarinoSao Tome and PrincipeSaudi ArabiaSenegalSerbiaSeychellesSierra LeoneSlovak RepublicSloveniaSmall statesSolomon IslandsSomaliaSouth AfricaSouth AsiaSouth Asia (IDA & IBRD)South SudanSpainSri LankaSt. Kitts and NevisSt. LuciaSt. Vincent and the GrenadinesSub-Saharan Africa Sub-Saharan Africa (excluding high income)Sub-Saharan Africa (IDA & IBRD countries)SudanSurinameSwazilandSwedenSwitzerlandSyrian Arab RepublicTajikistanTanzaniaThailandTimor-LesteTogoTongaTrinidad and TobagoTunisiaTurkeyTurkmenistanTurks and Caicos IslandsTuvaluUgandaUkraineUnited Arab EmiratesUnited KingdomUnited StatesUpper middle incomeUruguayUzbekistanVanuatuVenezuela, RBVietnamVirgin Islands (U.S.)West Bank and GazaWorldYemen, Rep.ZambiaZimbabwe Linha do tempo:
Nesta escala de tempo está apresentado um gráfico de 1961 ano até 2016 ano Philippines. Dados de 1960 ano ausente. O número de observações reais por data: 56.
Fonte (nome):
Indicadores de desenvolvimento mundial
Fonte (organização):
World Bank Staff estimates based on United Nations, World Urbanization Prospects.
Categorias:
Agriculture & Rural Development
Foi atualizado:
23 abr 2017 ano
Indicadores de alterações dos valores ao longo dos anos
Mínimo:
0.417
1 jan 1990 ano
Máximo:
2.966
1 jan 1962 ano
Na data de observação
Valor
Mudança absoluta
A alteração em relação ao valor anterior
1 jan 1961 ano
2.912
+2.912
0.0%
1 jan 1962 ano
2.966
+0.055
1.88%
1 jan 1963 ano
2.942
-0.024
-0.82%
1 jan 1964 ano
2.899
-0.043
-1.45%
1 jan 1965 ano
2.826
-0.073
-2.52%
1 jan 1966 ano
2.74
-0.087
-3.07%
1 jan 1967 ano
2.65
-0.09
-3.27%
1 jan 1968 ano
2.574
-0.076
-2.87%
1 jan 1969 ano
2.518
-0.056
-2.18%
1 jan 1970 ano
2.49
-0.028
-1.1%
1 jan 1971 ano
2.425
-0.065
-2.61%
1 jan 1972 ano
2.111
-0.314
-12.96%
1 jan 1973 ano
2.09
-0.02
-0.96%
1 jan 1974 ano
2.068
-0.022
-1.05%
1 jan 1975 ano
2.032
-0.036
-1.73%
1 jan 1976 ano
2.038
+0.005
0.27%
1 jan 1977 ano
2.229
+0.191
9.38%
1 jan 1978 ano
2.202
-0.027
-1.22%
1 jan 1979 ano
2.181
-0.021
-0.94%
1 jan 1980 ano
2.17
-0.011
-0.5%
1 jan 1981 ano
1.973
-0.197
-9.08%
1 jan 1982 ano
0.985
-0.988
-50.06%
1 jan 1983 ano
0.926
-0.06
-6.04%
1 jan 1984 ano
0.868
-0.058
-6.27%
1 jan 1985 ano
0.8
-0.067
-7.77%
1 jan 1986 ano
0.738
-0.062
-7.73%
1 jan 1987 ano
0.668
-0.07
-9.5%
1 jan 1988 ano
0.593
-0.075
-11.21%
1 jan 1989 ano
0.508
-0.086
-14.47%
1 jan 1990 ano
0.417
-0.091
-17.91%
1 jan 1991 ano
0.706
+0.289
69.34%
1 jan 1992 ano
2.608
+1.902
269.63%
1 jan 1993 ano
2.557
-0.051
-1.95%
1 jan 1994 ano
2.509
-0.048
-1.86%
1 jan 1995 ano
2.467
-0.043
-1.7%
1 jan 1996 ano
2.427
-0.039
-1.59%
1 jan 1997 ano
2.384
-0.044
-1.81%
1 jan 1998 ano
2.338
-0.046
-1.91%
1 jan 1999 ano
2.301
-0.037
-1.59%
1 jan 2000 ano
2.274
-0.027
-1.16%
1 jan 2001 ano
2.319
+0.045
1.96%
1 jan 2002 ano
2.642
+0.324
13.96%
1 jan 2003 ano
2.615
-0.027
-1.03%
1 jan 2004 ano
2.556
-0.059
-2.26%
1 jan 2005 ano
2.45
-0.106
-4.14%
1 jan 2006 ano
2.315
-0.135
-5.52%
1 jan 2007 ano
2.175
-0.14
-6.03%
1 jan 2008 ano
2.057
-0.119
-5.45%
1 jan 2009 ano
1.985
-0.072
-3.49%
1 jan 2010 ano
1.973
-0.012
-0.59%
1 jan 2011 ano
2.006
+0.032
1.63%
1 jan 2012 ano
1.993
-0.012
-0.61%
1 jan 2013 ano
1.967
-0.026
-1.3%
1 jan 2014 ano
1.926
-0.041
-2.1%
1 jan 2015 ano
1.855
-0.071
-3.7%
1 jan 2016 ano
1.769
-0.086
-4.63%
Classificação de países por estatísticas atuais por anos


Comentários: