29
/pt/
pt
AIzaSyAYiBZKx7MnpbEhh9jyipgxe19OcubqV5w
April 1, 2024
275195
United Arab Emirates
ARE
true
2
1
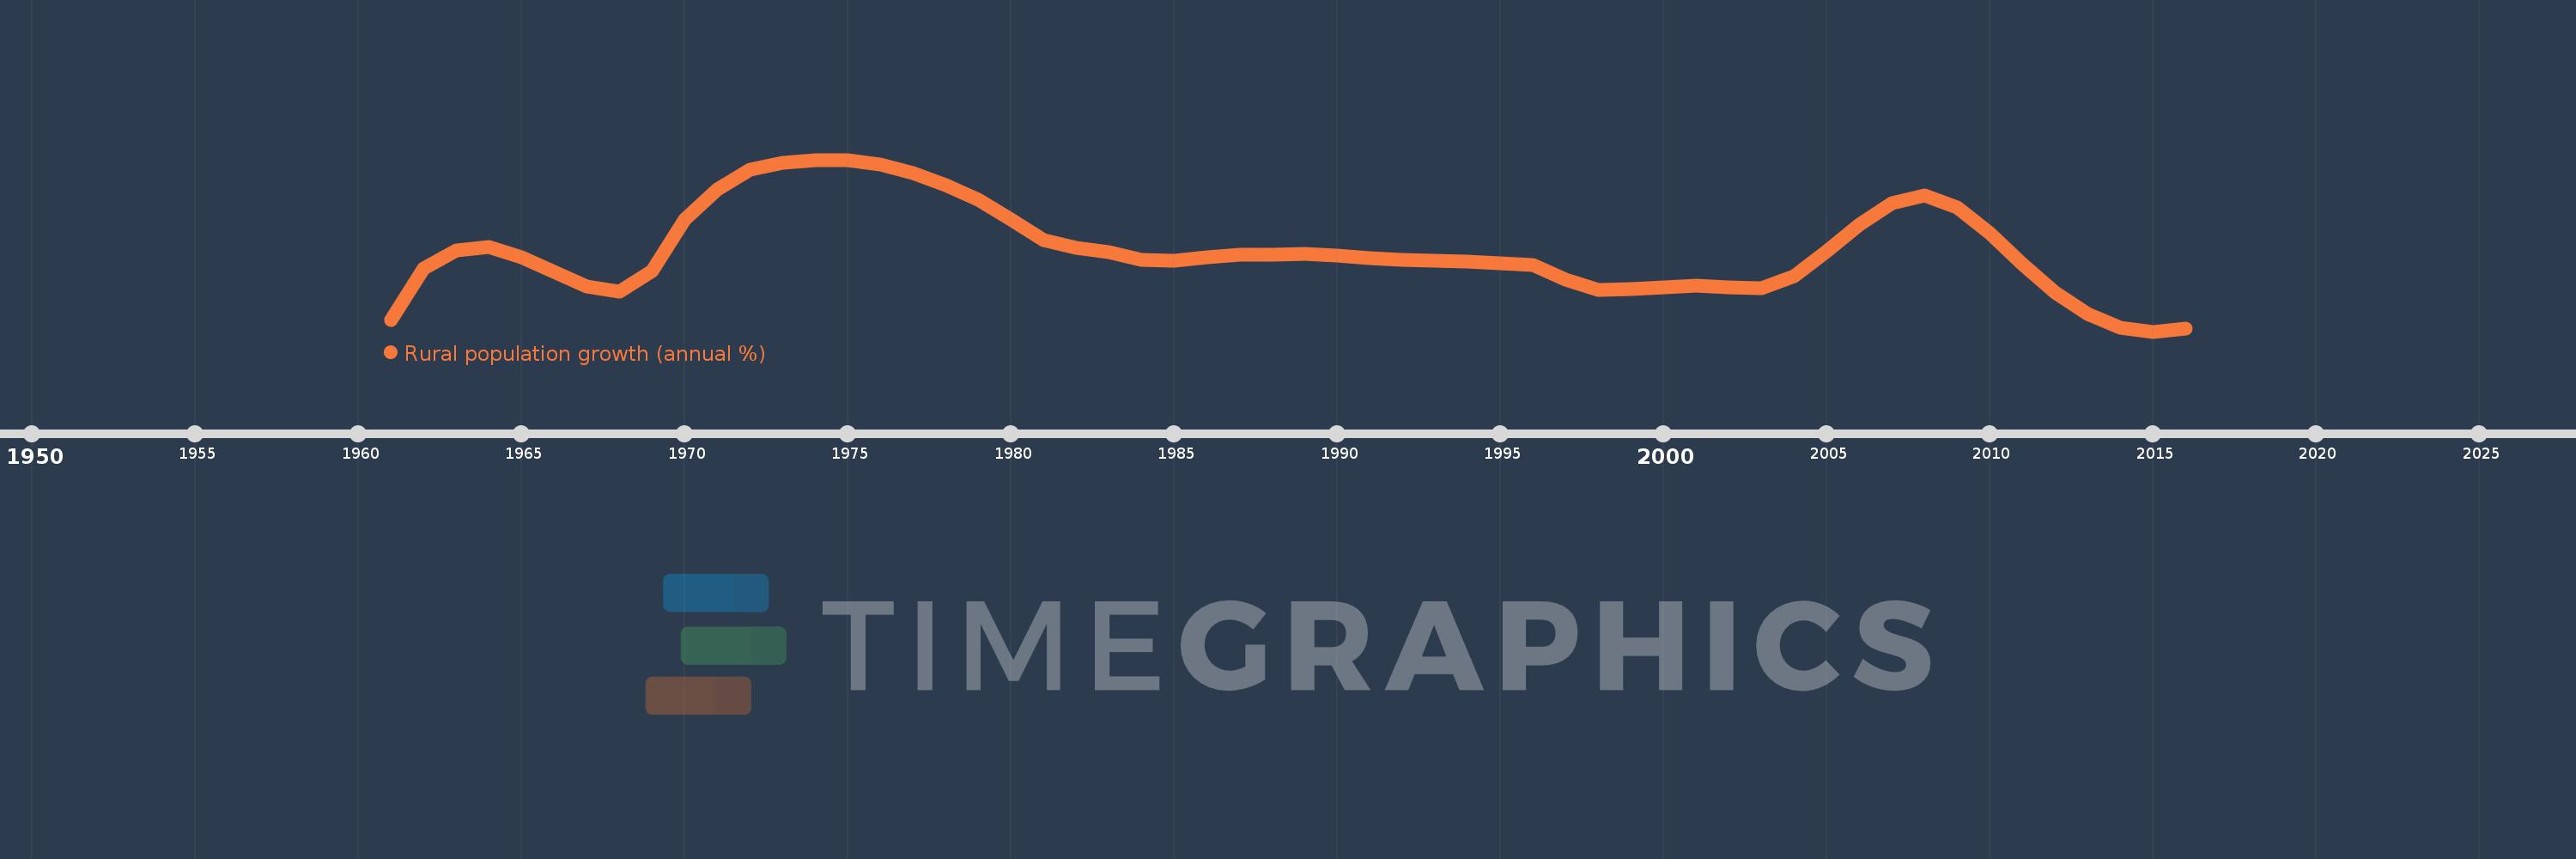
Rural population growth (annual %)
2016,2015,2014,2013,2012,2011,2010,2009,2008,2007,2006,2005,2004,2003,2002,2001,2000,1999,1998,1997,1996,1995,1994,1993,1992,1991,1990,1989,1988,1987,1986,1985,1984,1983,1982,1981,1980,1979,1978,1977,1976,1975,1974,1973,1972,1971,1970,1969,1968,1967,1966,1965,1964,1963,1962,1961
Estas estatísticas em outros países:
AfghanistanAlbaniaAlgeriaAmerican SamoaAndorraAngolaAntigua and BarbudaArab WorldArgentinaArmeniaArubaAustraliaAustriaAzerbaijanBahamas, TheBahrainBangladeshBarbadosBelarusBelgiumBelizeBeninBhutanBoliviaBosnia and HerzegovinaBotswanaBrazilBritish Virgin IslandsBrunei DarussalamBulgariaBurkina FasoBurundiCabo VerdeCambodiaCameroonCanadaCaribbean small statesCentral African RepublicCentral Europe and the BalticsChadChannel IslandsChileChinaColombiaComorosCongo, Dem. Rep.Congo, Rep.Costa RicaCote d'IvoireCroatiaCubaCuracaoCyprusCzech RepublicDenmarkDjiboutiDominicaDominican RepublicEarly-demographic dividendEast Asia & PacificEast Asia & Pacific (excluding high income)East Asia & Pacific (IDA & IBRD countries)EcuadorEgypt, Arab Rep.El SalvadorEquatorial GuineaEritreaEstoniaEthiopiaEuro areaEurope & Central AsiaEurope & Central Asia (excluding high income)Europe & Central Asia (IDA & IBRD countries)European UnionFaroe IslandsFijiFinlandFragile and conflict affected situationsFranceFrench PolynesiaGabonGambia, TheGeorgiaGermanyGhanaGreeceGreenlandGrenadaGuamGuatemalaGuineaGuinea-BissauGuyanaHaitiHeavily indebted poor countries (HIPC)High incomeHondurasHong Kong SAR, ChinaHungaryIBRD onlyIcelandIDA & IBRD totalIDA blendIDA onlyIDA totalIndiaIndonesiaIran, Islamic Rep.IraqIrelandIsle of ManIsraelItalyJamaicaJapanJordanKazakhstanKenyaKiribatiKorea, Dem. People’s Rep.Korea, Rep.KuwaitKyrgyz RepublicLao PDRLate-demographic dividendLatin America & Caribbean Latin America & Caribbean (excluding high income)Latin America & the Caribbean (IDA & IBRD countries)LatviaLeast developed countries: UN classificationLebanonLesothoLiberiaLibyaLiechtensteinLithuaniaLow & middle incomeLow incomeLower middle incomeLuxembourgMacao SAR, ChinaMacedonia, FYRMadagascarMalawiMalaysiaMaldivesMaliMaltaMarshall IslandsMauritaniaMauritiusMexicoMicronesia, Fed. Sts.Middle East & North AfricaMiddle East & North Africa (excluding high income)Middle East & North Africa (IDA & IBRD countries)Middle incomeMoldovaMongoliaMontenegroMoroccoMozambiqueMyanmarNamibiaNauruNepalNetherlandsNew CaledoniaNew ZealandNicaraguaNigerNigeriaNorth AmericaNorthern Mariana IslandsNorwayOECD membersOmanOther small statesPacific island small statesPakistanPalauPanamaPapua New GuineaParaguayPeruPhilippinesPolandPortugalPost-demographic dividendPre-demographic dividendPuerto RicoQatarRomaniaRussian FederationRwandaSamoaSan MarinoSao Tome and PrincipeSaudi ArabiaSenegalSerbiaSeychellesSierra LeoneSlovak RepublicSloveniaSmall statesSolomon IslandsSomaliaSouth AfricaSouth AsiaSouth Asia (IDA & IBRD)South SudanSpainSri LankaSt. Kitts and NevisSt. LuciaSt. Vincent and the GrenadinesSub-Saharan Africa Sub-Saharan Africa (excluding high income)Sub-Saharan Africa (IDA & IBRD countries)SudanSurinameSwazilandSwedenSwitzerlandSyrian Arab RepublicTajikistanTanzaniaThailandTimor-LesteTogoTongaTrinidad and TobagoTunisiaTurkeyTurkmenistanTurks and Caicos IslandsTuvaluUgandaUkraineUnited Arab EmiratesUnited KingdomUnited StatesUpper middle incomeUruguayUzbekistanVanuatuVenezuela, RBVietnamVirgin Islands (U.S.)West Bank and GazaWorldYemen, Rep.ZambiaZimbabwe Linha do tempo:
Nesta escala de tempo está apresentado um gráfico de 1961 ano até 2016 ano United Arab Emirates. Dados de 1960 ano ausente. O número de observações reais por data: 56.
Fonte (nome):
Indicadores de desenvolvimento mundial
Fonte (organização):
World Bank Staff estimates based on United Nations, World Urbanization Prospects.
Categorias:
Agriculture & Rural Development
Foi atualizado:
23 abr 2017 ano
Indicadores de alterações dos valores ao longo dos anos
Mínimo:
-1.406
1 jan 2015 ano
Máximo:
16.661
1 jan 1974 ano
Na data de observação
Valor
Mudança absoluta
A alteração em relação ao valor anterior
1 jan 1961 ano
-0.204
-0.204
0.0%
1 jan 1962 ano
5.266
+5.469
-2.69 mil%
1 jan 1963 ano
7.134
+1.868
35.48%
1 jan 1964 ano
7.464
+0.33
4.62%
1 jan 1965 ano
6.367
-1.097
-14.69%
1 jan 1966 ano
4.843
-1.524
-23.94%
1 jan 1967 ano
3.328
-1.515
-31.29%
1 jan 1968 ano
2.814
-0.514
-15.43%
1 jan 1969 ano
5.001
+2.187
77.72%
1 jan 1970 ano
10.374
+5.373
107.44%
1 jan 1971 ano
13.565
+3.191
30.76%
1 jan 1972 ano
15.591
+2.026
14.93%
1 jan 1973 ano
16.361
+0.77
4.94%
1 jan 1974 ano
16.661
+0.3
1.83%
1 jan 1975 ano
16.599
-0.062
-0.37%
1 jan 1976 ano
16.17
-0.429
-2.58%
1 jan 1977 ano
15.265
-0.906
-5.6%
1 jan 1978 ano
14.003
-1.262
-8.27%
1 jan 1979 ano
12.482
-1.521
-10.86%
1 jan 1980 ano
10.374
-2.108
-16.89%
1 jan 1981 ano
8.181
-2.192
-21.13%
1 jan 1982 ano
7.377
-0.804
-9.83%
1 jan 1983 ano
6.925
-0.452
-6.13%
1 jan 1984 ano
6.144
-0.781
-11.28%
1 jan 1985 ano
6.081
-0.063
-1.02%
1 jan 1986 ano
6.44
+0.359
5.9%
1 jan 1987 ano
6.651
+0.211
3.27%
1 jan 1988 ano
6.694
+0.043
0.65%
1 jan 1989 ano
6.755
+0.062
0.92%
1 jan 1990 ano
6.597
-0.158
-2.34%
1 jan 1991 ano
6.335
-0.263
-3.98%
1 jan 1992 ano
6.154
-0.181
-2.85%
1 jan 1993 ano
6.074
-0.08
-1.3%
1 jan 1994 ano
5.936
-0.138
-2.27%
1 jan 1995 ano
5.744
-0.192
-3.23%
1 jan 1996 ano
5.564
-0.18
-3.14%
1 jan 1997 ano
4.074
-1.49
-26.77%
1 jan 1998 ano
2.947
-1.128
-27.68%
1 jan 1999 ano
3.09
+0.143
4.86%
1 jan 2000 ano
3.239
+0.149
4.83%
1 jan 2001 ano
3.461
+0.222
6.86%
1 jan 2002 ano
3.211
-0.251
-7.24%
1 jan 2003 ano
3.178
-0.033
-1.02%
1 jan 2004 ano
4.443
+1.264
39.79%
1 jan 2005 ano
7.042
+2.599
58.51%
1 jan 2006 ano
9.8
+2.758
39.17%
1 jan 2007 ano
12.105
+2.305
23.52%
1 jan 2008 ano
12.871
+0.766
6.33%
1 jan 2009 ano
11.679
-1.192
-9.26%
1 jan 2010 ano
8.935
-2.745
-23.5%
1 jan 2011 ano
5.727
-3.208
-35.91%
1 jan 2012 ano
2.724
-3.003
-52.44%
1 jan 2013 ano
0.466
-2.258
-82.9%
1 jan 2014 ano
-0.986
-1.452
-311.77%
1 jan 2015 ano
-1.406
-0.42
42.6%
1 jan 2016 ano
-1.108
+0.299
-21.24%
Classificação de países por estatísticas atuais por anos


Comentários: