29
/pt/
pt
AIzaSyAYiBZKx7MnpbEhh9jyipgxe19OcubqV5w
April 1, 2024
131592
Faroe Islands
FRO
true
2
1
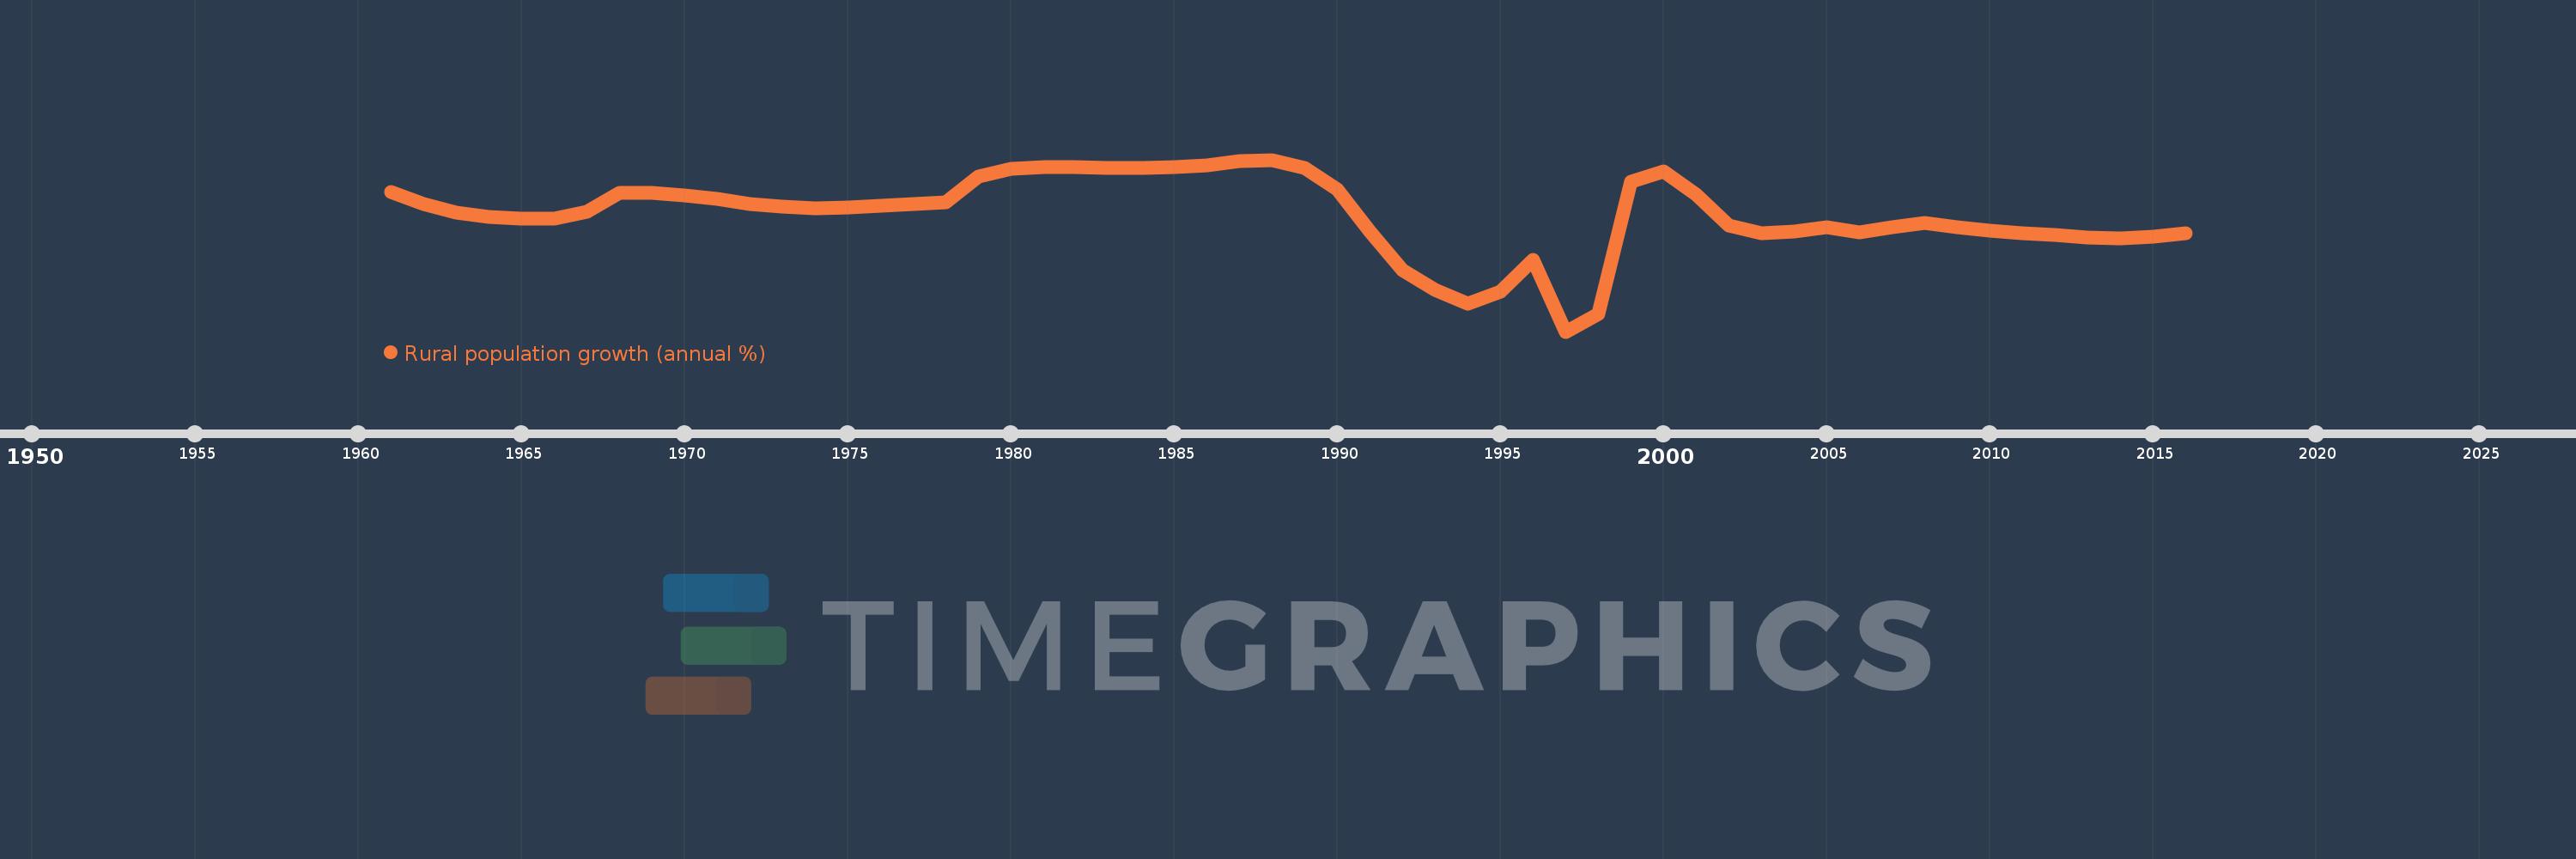
Rural population growth (annual %)
2016,2015,2014,2013,2012,2011,2010,2009,2008,2007,2006,2005,2004,2003,2002,2001,2000,1999,1998,1997,1996,1995,1994,1993,1992,1991,1990,1989,1988,1987,1986,1985,1984,1983,1982,1981,1980,1979,1978,1977,1976,1975,1974,1973,1972,1971,1970,1969,1968,1967,1966,1965,1964,1963,1962,1961
Estas estatísticas em outros países:
AfghanistanAlbaniaAlgeriaAmerican SamoaAndorraAngolaAntigua and BarbudaArab WorldArgentinaArmeniaArubaAustraliaAustriaAzerbaijanBahamas, TheBahrainBangladeshBarbadosBelarusBelgiumBelizeBeninBhutanBoliviaBosnia and HerzegovinaBotswanaBrazilBritish Virgin IslandsBrunei DarussalamBulgariaBurkina FasoBurundiCabo VerdeCambodiaCameroonCanadaCaribbean small statesCentral African RepublicCentral Europe and the BalticsChadChannel IslandsChileChinaColombiaComorosCongo, Dem. Rep.Congo, Rep.Costa RicaCote d'IvoireCroatiaCubaCuracaoCyprusCzech RepublicDenmarkDjiboutiDominicaDominican RepublicEarly-demographic dividendEast Asia & PacificEast Asia & Pacific (excluding high income)East Asia & Pacific (IDA & IBRD countries)EcuadorEgypt, Arab Rep.El SalvadorEquatorial GuineaEritreaEstoniaEthiopiaEuro areaEurope & Central AsiaEurope & Central Asia (excluding high income)Europe & Central Asia (IDA & IBRD countries)European UnionFaroe IslandsFijiFinlandFragile and conflict affected situationsFranceFrench PolynesiaGabonGambia, TheGeorgiaGermanyGhanaGreeceGreenlandGrenadaGuamGuatemalaGuineaGuinea-BissauGuyanaHaitiHeavily indebted poor countries (HIPC)High incomeHondurasHong Kong SAR, ChinaHungaryIBRD onlyIcelandIDA & IBRD totalIDA blendIDA onlyIDA totalIndiaIndonesiaIran, Islamic Rep.IraqIrelandIsle of ManIsraelItalyJamaicaJapanJordanKazakhstanKenyaKiribatiKorea, Dem. People’s Rep.Korea, Rep.KuwaitKyrgyz RepublicLao PDRLate-demographic dividendLatin America & Caribbean Latin America & Caribbean (excluding high income)Latin America & the Caribbean (IDA & IBRD countries)LatviaLeast developed countries: UN classificationLebanonLesothoLiberiaLibyaLiechtensteinLithuaniaLow & middle incomeLow incomeLower middle incomeLuxembourgMacao SAR, ChinaMacedonia, FYRMadagascarMalawiMalaysiaMaldivesMaliMaltaMarshall IslandsMauritaniaMauritiusMexicoMicronesia, Fed. Sts.Middle East & North AfricaMiddle East & North Africa (excluding high income)Middle East & North Africa (IDA & IBRD countries)Middle incomeMoldovaMongoliaMontenegroMoroccoMozambiqueMyanmarNamibiaNauruNepalNetherlandsNew CaledoniaNew ZealandNicaraguaNigerNigeriaNorth AmericaNorthern Mariana IslandsNorwayOECD membersOmanOther small statesPacific island small statesPakistanPalauPanamaPapua New GuineaParaguayPeruPhilippinesPolandPortugalPost-demographic dividendPre-demographic dividendPuerto RicoQatarRomaniaRussian FederationRwandaSamoaSan MarinoSao Tome and PrincipeSaudi ArabiaSenegalSerbiaSeychellesSierra LeoneSlovak RepublicSloveniaSmall statesSolomon IslandsSomaliaSouth AfricaSouth AsiaSouth Asia (IDA & IBRD)South SudanSpainSri LankaSt. Kitts and NevisSt. LuciaSt. Vincent and the GrenadinesSub-Saharan Africa Sub-Saharan Africa (excluding high income)Sub-Saharan Africa (IDA & IBRD countries)SudanSurinameSwazilandSwedenSwitzerlandSyrian Arab RepublicTajikistanTanzaniaThailandTimor-LesteTogoTongaTrinidad and TobagoTunisiaTurkeyTurkmenistanTurks and Caicos IslandsTuvaluUgandaUkraineUnited Arab EmiratesUnited KingdomUnited StatesUpper middle incomeUruguayUzbekistanVanuatuVenezuela, RBVietnamVirgin Islands (U.S.)West Bank and GazaWorldYemen, Rep.ZambiaZimbabwe Linha do tempo:
Nesta escala de tempo está apresentado um gráfico de 1961 ano até 2016 ano Faroe Islands. Dados de 1960 ano ausente. O número de observações reais por data: 56.
Fonte (nome):
Indicadores de desenvolvimento mundial
Fonte (organização):
World Bank Staff estimates based on United Nations, World Urbanization Prospects.
Categorias:
Agriculture & Rural Development
Foi atualizado:
23 abr 2017 ano
Indicadores de alterações dos valores ao longo dos anos
Mínimo:
-3.141
1 jan 1997 ano
Na data de observação
Valor
Mudança absoluta
A alteração em relação ao valor anterior
1 jan 1961 ano
0.708
+0.708
0.0%
1 jan 1962 ano
0.374
-0.334
-47.13%
1 jan 1963 ano
0.152
-0.223
-59.51%
1 jan 1964 ano
0.022
-0.129
-85.38%
1 jan 1965 ano
-0.033
-0.055
-250.01%
1 jan 1966 ano
-0.026
+0.007
-22.2%
1 jan 1967 ano
0.159
+0.185
-713.88%
1 jan 1968 ano
0.691
+0.532
335.35%
1 jan 1969 ano
0.679
-0.012
-1.74%
1 jan 1970 ano
0.624
-0.055
-8.13%
1 jan 1971 ano
0.512
-0.112
-17.91%
1 jan 1972 ano
0.37
-0.142
-27.78%
1 jan 1973 ano
0.304
-0.066
-17.75%
1 jan 1974 ano
0.268
-0.037
-12.02%
1 jan 1975 ano
0.285
+0.017
6.37%
1 jan 1976 ano
0.33
+0.045
15.89%
1 jan 1977 ano
0.389
+0.059
17.86%
1 jan 1978 ano
0.433
+0.044
11.36%
1 jan 1979 ano
1.128
+0.695
160.56%
1 jan 1980 ano
1.359
+0.231
20.47%
1 jan 1981 ano
1.392
+0.032
2.39%
1 jan 1982 ano
1.392
+0.001
0.06%
1 jan 1983 ano
1.367
-0.026
-1.85%
1 jan 1984 ano
1.374
+0.008
0.55%
1 jan 1985 ano
1.407
+0.033
2.37%
1 jan 1986 ano
1.441
+0.034
2.42%
1 jan 1987 ano
1.554
+0.113
7.84%
1 jan 1988 ano
1.6
+0.046
2.99%
1 jan 1989 ano
1.371
-0.23
-14.36%
1 jan 1990 ano
0.78
-0.591
-43.09%
1 jan 1991 ano
-0.389
-1.169
-149.9%
1 jan 1992 ano
-1.441
-1.052
270.29%
1 jan 1993 ano
-1.995
-0.554
38.42%
1 jan 1994 ano
-2.372
-0.377
18.9%
1 jan 1995 ano
-2.043
+0.329
-13.88%
1 jan 1996 ano
-1.168
+0.874
-42.8%
1 jan 1997 ano
-3.141
-1.973
168.85%
1 jan 1998 ano
-2.654
+0.488
-15.53%
1 jan 1999 ano
1.007
+3.661
-137.96%
1 jan 2000 ano
1.273
+0.266
26.39%
1 jan 2001 ano
0.641
-0.632
-49.68%
1 jan 2002 ano
-0.213
-0.854
-133.26%
1 jan 2003 ano
-0.424
-0.211
99.05%
1 jan 2004 ano
-0.368
+0.056
-13.26%
1 jan 2005 ano
-0.267
+0.101
-27.55%
1 jan 2006 ano
-0.398
-0.131
49.21%
1 jan 2007 ano
-0.261
+0.136
-34.27%
1 jan 2008 ano
-0.131
+0.13
-49.9%
1 jan 2009 ano
-0.266
-0.135
103.03%
1 jan 2010 ano
-0.364
-0.098
36.79%
1 jan 2011 ano
-0.424
-0.061
16.65%
1 jan 2012 ano
-0.486
-0.061
14.45%
1 jan 2013 ano
-0.544
-0.059
12.09%
1 jan 2014 ano
-0.565
-0.021
3.8%
1 jan 2015 ano
-0.511
+0.054
-9.51%
1 jan 2016 ano
-0.421
+0.09
-17.67%
Classificação de países por estatísticas atuais por anos


Comentários: