29
/pt/
pt
AIzaSyAYiBZKx7MnpbEhh9jyipgxe19OcubqV5w
April 1, 2024
64072
Afghanistan
AFG
true
2
1
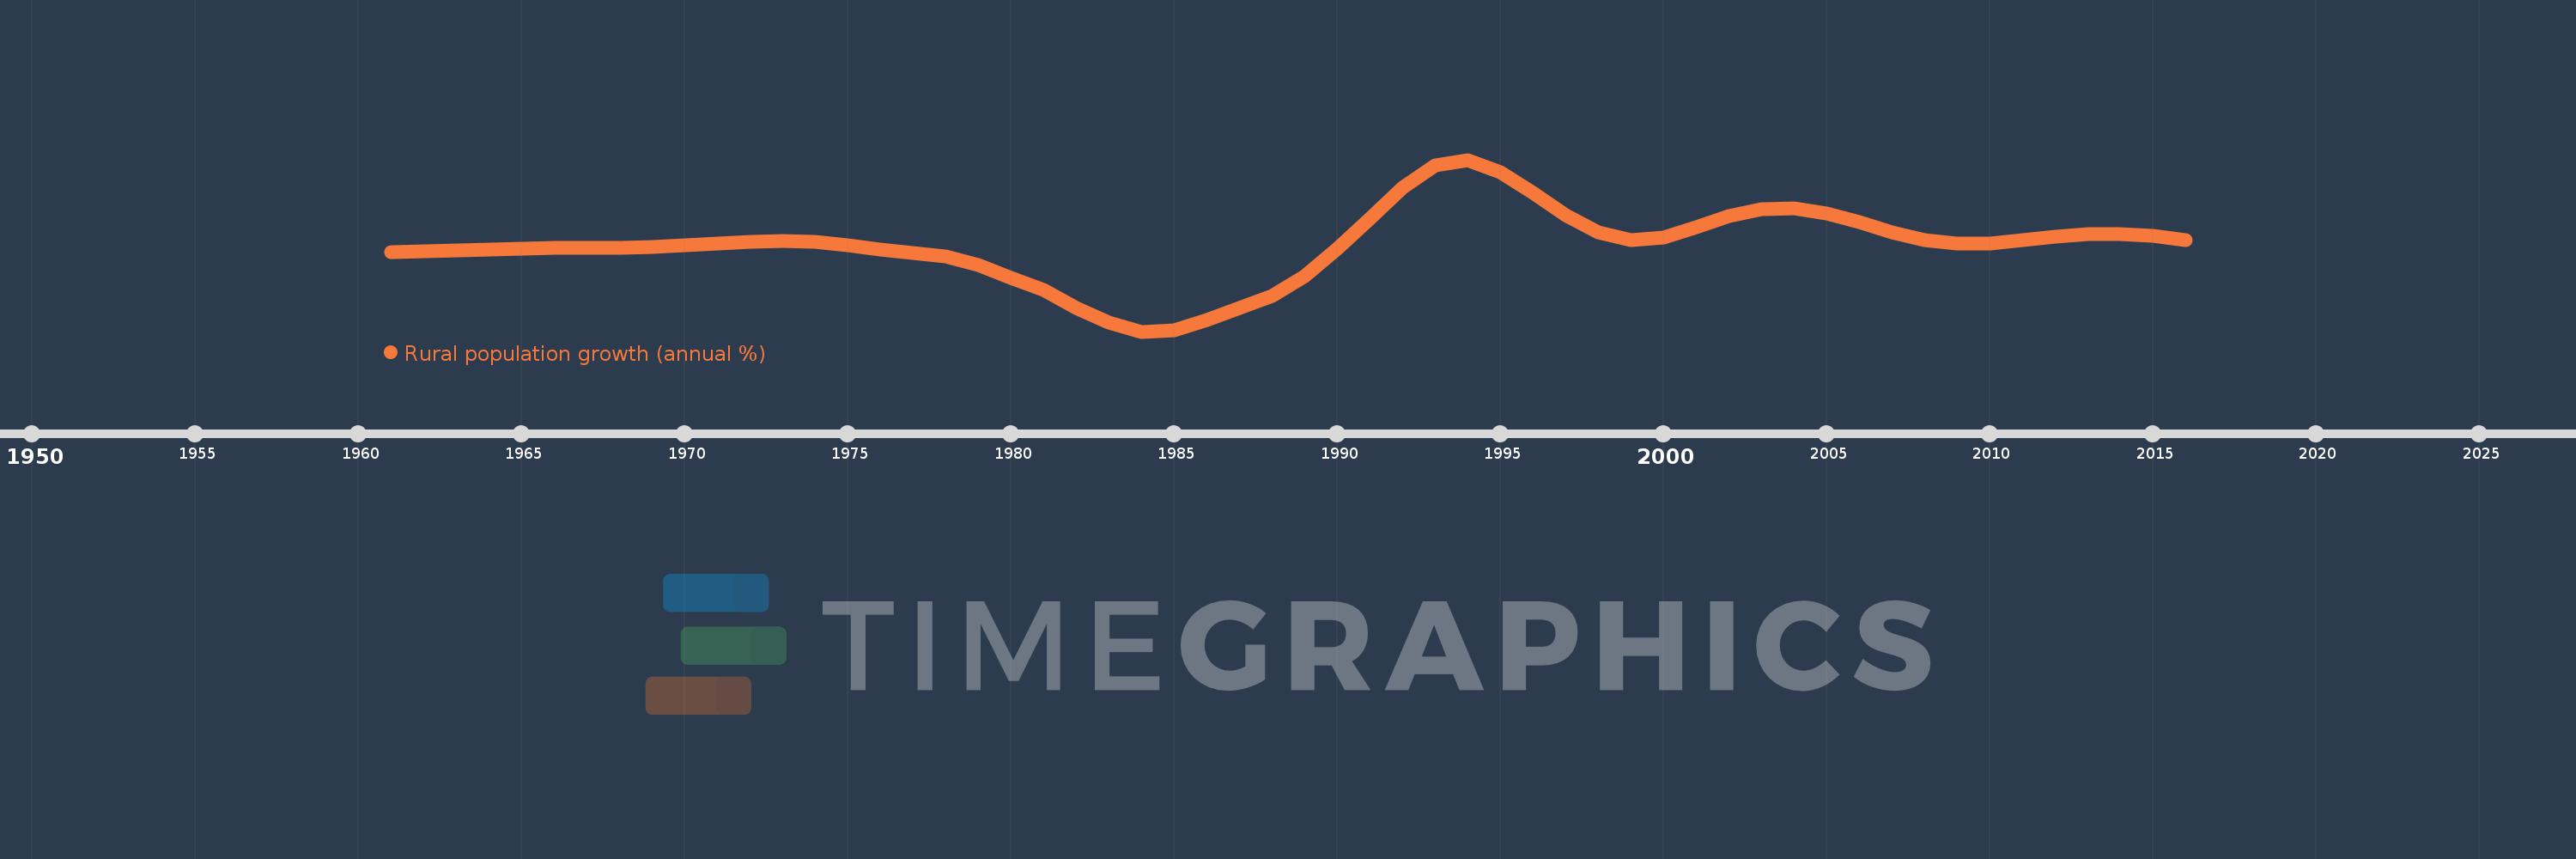
Rural population growth (annual %)
2016,2015,2014,2013,2012,2011,2010,2009,2008,2007,2006,2005,2004,2003,2002,2001,2000,1999,1998,1997,1996,1995,1994,1993,1992,1991,1990,1989,1988,1987,1986,1985,1984,1983,1982,1981,1980,1979,1978,1977,1976,1975,1974,1973,1972,1971,1970,1969,1968,1967,1966,1965,1964,1963,1962,1961
Estas estatísticas em outros países:
AfghanistanAlbaniaAlgeriaAmerican SamoaAndorraAngolaAntigua and BarbudaArab WorldArgentinaArmeniaArubaAustraliaAustriaAzerbaijanBahamas, TheBahrainBangladeshBarbadosBelarusBelgiumBelizeBeninBhutanBoliviaBosnia and HerzegovinaBotswanaBrazilBritish Virgin IslandsBrunei DarussalamBulgariaBurkina FasoBurundiCabo VerdeCambodiaCameroonCanadaCaribbean small statesCentral African RepublicCentral Europe and the BalticsChadChannel IslandsChileChinaColombiaComorosCongo, Dem. Rep.Congo, Rep.Costa RicaCote d'IvoireCroatiaCubaCuracaoCyprusCzech RepublicDenmarkDjiboutiDominicaDominican RepublicEarly-demographic dividendEast Asia & PacificEast Asia & Pacific (excluding high income)East Asia & Pacific (IDA & IBRD countries)EcuadorEgypt, Arab Rep.El SalvadorEquatorial GuineaEritreaEstoniaEthiopiaEuro areaEurope & Central AsiaEurope & Central Asia (excluding high income)Europe & Central Asia (IDA & IBRD countries)European UnionFaroe IslandsFijiFinlandFragile and conflict affected situationsFranceFrench PolynesiaGabonGambia, TheGeorgiaGermanyGhanaGreeceGreenlandGrenadaGuamGuatemalaGuineaGuinea-BissauGuyanaHaitiHeavily indebted poor countries (HIPC)High incomeHondurasHong Kong SAR, ChinaHungaryIBRD onlyIcelandIDA & IBRD totalIDA blendIDA onlyIDA totalIndiaIndonesiaIran, Islamic Rep.IraqIrelandIsle of ManIsraelItalyJamaicaJapanJordanKazakhstanKenyaKiribatiKorea, Dem. People’s Rep.Korea, Rep.KuwaitKyrgyz RepublicLao PDRLate-demographic dividendLatin America & Caribbean Latin America & Caribbean (excluding high income)Latin America & the Caribbean (IDA & IBRD countries)LatviaLeast developed countries: UN classificationLebanonLesothoLiberiaLibyaLiechtensteinLithuaniaLow & middle incomeLow incomeLower middle incomeLuxembourgMacao SAR, ChinaMacedonia, FYRMadagascarMalawiMalaysiaMaldivesMaliMaltaMarshall IslandsMauritaniaMauritiusMexicoMicronesia, Fed. Sts.Middle East & North AfricaMiddle East & North Africa (excluding high income)Middle East & North Africa (IDA & IBRD countries)Middle incomeMoldovaMongoliaMontenegroMoroccoMozambiqueMyanmarNamibiaNauruNepalNetherlandsNew CaledoniaNew ZealandNicaraguaNigerNigeriaNorth AmericaNorthern Mariana IslandsNorwayOECD membersOmanOther small statesPacific island small statesPakistanPalauPanamaPapua New GuineaParaguayPeruPhilippinesPolandPortugalPost-demographic dividendPre-demographic dividendPuerto RicoQatarRomaniaRussian FederationRwandaSamoaSan MarinoSao Tome and PrincipeSaudi ArabiaSenegalSerbiaSeychellesSierra LeoneSlovak RepublicSloveniaSmall statesSolomon IslandsSomaliaSouth AfricaSouth AsiaSouth Asia (IDA & IBRD)South SudanSpainSri LankaSt. Kitts and NevisSt. LuciaSt. Vincent and the GrenadinesSub-Saharan Africa Sub-Saharan Africa (excluding high income)Sub-Saharan Africa (IDA & IBRD countries)SudanSurinameSwazilandSwedenSwitzerlandSyrian Arab RepublicTajikistanTanzaniaThailandTimor-LesteTogoTongaTrinidad and TobagoTunisiaTurkeyTurkmenistanTurks and Caicos IslandsTuvaluUgandaUkraineUnited Arab EmiratesUnited KingdomUnited StatesUpper middle incomeUruguayUzbekistanVanuatuVenezuela, RBVietnamVirgin Islands (U.S.)West Bank and GazaWorldYemen, Rep.ZambiaZimbabwe Linha do tempo:
Nesta escala de tempo está apresentado um gráfico de 1961 ano até 2016 ano Afghanistan. Dados de 1960 ano ausente. O número de observações reais por data: 56.
Fonte (nome):
Indicadores de desenvolvimento mundial
Fonte (organização):
World Bank Staff estimates based on United Nations, World Urbanization Prospects.
Categorias:
Agriculture & Rural Development
Foi atualizado:
23 abr 2017 ano
Indicadores de alterações dos valores ao longo dos anos
Mínimo:
-3.415
1 jan 1984 ano
Máximo:
7.199
1 jan 1994 ano
Na data de observação
Valor
Mudança absoluta
A alteração em relação ao valor anterior
1 jan 1961 ano
1.511
+1.511
0.0%
1 jan 1962 ano
1.561
+0.05
3.28%
1 jan 1963 ano
1.607
+0.046
2.98%
1 jan 1964 ano
1.655
+0.047
2.96%
1 jan 1965 ano
1.698
+0.044
2.64%
1 jan 1966 ano
1.744
+0.046
2.69%
1 jan 1967 ano
1.754
+0.01
0.57%
1 jan 1968 ano
1.758
+0.004
0.21%
1 jan 1969 ano
1.807
+0.049
2.8%
1 jan 1970 ano
1.917
+0.111
6.12%
1 jan 1971 ano
2.047
+0.13
6.76%
1 jan 1972 ano
2.15
+0.103
5.01%
1 jan 1973 ano
2.175
+0.026
1.19%
1 jan 1974 ano
2.106
-0.069
-3.18%
1 jan 1975 ano
1.922
-0.184
-8.73%
1 jan 1976 ano
1.647
-0.275
-14.32%
1 jan 1977 ano
1.437
-0.21
-12.72%
1 jan 1978 ano
1.205
-0.232
-16.16%
1 jan 1979 ano
0.711
-0.494
-40.97%
1 jan 1980 ano
-0.104
-0.816
-114.65%
1 jan 1981 ano
-0.834
-0.73
700.08%
1 jan 1982 ano
-1.933
-1.099
131.77%
1 jan 1983 ano
-2.871
-0.939
48.58%
1 jan 1984 ano
-3.415
-0.543
18.93%
1 jan 1985 ano
-3.341
+0.074
-2.15%
1 jan 1986 ano
-2.711
+0.631
-18.87%
1 jan 1987 ano
-1.98
+0.731
-26.95%
1 jan 1988 ano
-1.211
+0.769
-38.83%
1 jan 1989 ano
0.003
+1.214
-100.24%
1 jan 1990 ano
1.689
+1.686
57.15 mil%
1 jan 1991 ano
3.54
+1.851
109.59%
1 jan 1992 ano
5.465
+1.925
54.37%
1 jan 1993 ano
6.86
+1.395
25.53%
1 jan 1994 ano
7.199
+0.34
4.95%
1 jan 1995 ano
6.454
-0.746
-10.36%
1 jan 1996 ano
5.164
-1.289
-19.98%
1 jan 1997 ano
3.77
-1.395
-27.0%
1 jan 1998 ano
2.733
-1.036
-27.49%
1 jan 1999 ano
2.229
-0.505
-18.46%
1 jan 2000 ano
2.417
+0.188
8.42%
1 jan 2001 ano
3.03
+0.614
25.39%
1 jan 2002 ano
3.723
+0.693
22.86%
1 jan 2003 ano
4.143
+0.42
11.28%
1 jan 2004 ano
4.226
+0.083
2.0%
1 jan 2005 ano
3.896
-0.33
-7.8%
1 jan 2006 ano
3.328
-0.569
-14.59%
1 jan 2007 ano
2.717
-0.611
-18.36%
1 jan 2008 ano
2.261
-0.456
-16.77%
1 jan 2009 ano
2.014
-0.247
-10.92%
1 jan 2010 ano
2.042
+0.028
1.37%
1 jan 2011 ano
2.239
+0.197
9.65%
1 jan 2012 ano
2.471
+0.233
10.39%
1 jan 2013 ano
2.608
+0.137
5.54%
1 jan 2014 ano
2.622
+0.014
0.53%
1 jan 2015 ano
2.477
-0.145
-5.52%
1 jan 2016 ano
2.23
-0.247
-9.98%
Classificação de países por estatísticas atuais por anos


Comentários: