29
/pt/
pt
AIzaSyAYiBZKx7MnpbEhh9jyipgxe19OcubqV5w
April 1, 2024
66440
Algeria
DZA
true
2
1
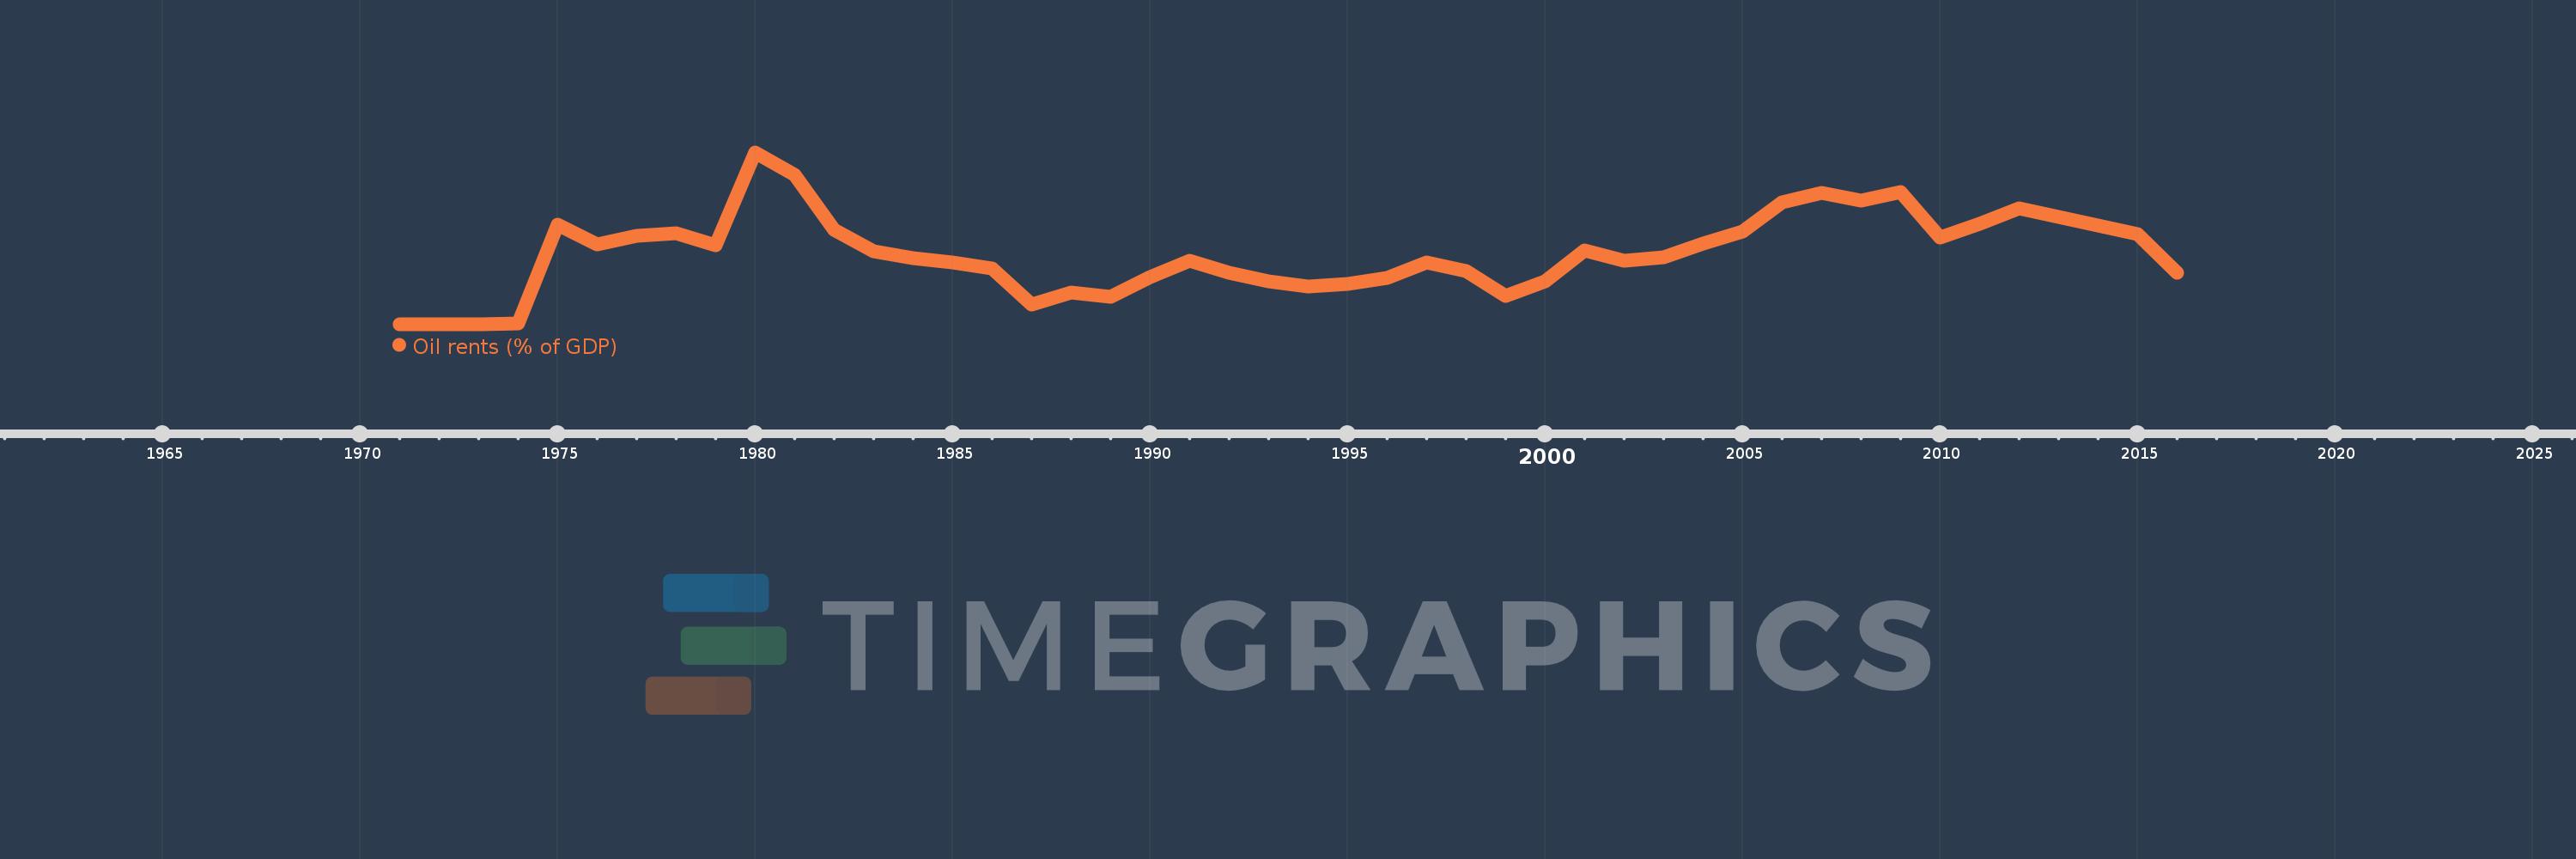
Oil rents (% of GDP)
2016,2015,2014,2013,2012,2011,2010,2009,2008,2007,2006,2005,2004,2003,2002,2001,2000,1999,1998,1997,1996,1995,1994,1993,1992,1991,1990,1989,1988,1987,1986,1985,1984,1983,1982,1981,1980,1979,1978,1977,1976,1975,1974,1973,1972,1971
Estas estatísticas em outros países:
Linha do tempo:
Nesta escala de tempo está apresentado um gráfico de 1971 ano até 2016 ano Algeria. Dados de 1970 ano ausente. O número de observações reais por data: 46.
Fonte (nome):
Indicadores de desenvolvimento mundial
Fonte (organização):
Estimates based on sources and methods described in "The Changing Wealth of Nations: Measuring Sustainable Development in the New Millennium" (World Bank, 2011).
Categorias:
Energy & Mining, Environment
Foi atualizado:
23 abr 2017 ano
Indicadores de alterações dos valores ao longo dos anos
Mínimo:
0.032
1 jan 1972 ano
Máximo:
30.105
1 jan 1980 ano
Na data de observação
Valor
Mudança absoluta
A alteração em relação ao valor anterior
1 jan 1971 ano
0.044
+0.044
0.0%
1 jan 1972 ano
0.032
-0.012
-26.86%
1 jan 1973 ano
0.062
+0.03
93.35%
1 jan 1974 ano
0.173
+0.11
177.31%
1 jan 1975 ano
17.397
+17.225
9.98 mil%
1 jan 1976 ano
13.96
-3.437
-19.76%
1 jan 1977 ano
15.525
+1.565
11.21%
1 jan 1978 ano
16.014
+0.489
3.15%
1 jan 1979 ano
13.869
-2.145
-13.4%
1 jan 1980 ano
30.105
+16.236
117.07%
1 jan 1981 ano
26.207
-3.899
-12.95%
1 jan 1982 ano
16.566
-9.641
-36.79%
1 jan 1983 ano
12.772
-3.794
-22.9%
1 jan 1984 ano
11.551
-1.22
-9.55%
1 jan 1985 ano
10.783
-0.768
-6.65%
1 jan 1986 ano
9.781
-1.002
-9.29%
1 jan 1987 ano
3.538
-6.243
-63.82%
1 jan 1988 ano
5.57
+2.032
57.42%
1 jan 1989 ano
4.774
-0.797
-14.3%
1 jan 1990 ano
8.339
+3.566
74.69%
1 jan 1991 ano
11.163
+2.824
33.87%
1 jan 1992 ano
9.036
-2.127
-19.06%
1 jan 1993 ano
7.608
-1.428
-15.8%
1 jan 1994 ano
6.695
-0.913
-11.99%
1 jan 1995 ano
7.092
+0.396
5.92%
1 jan 1996 ano
8.074
+0.982
13.85%
1 jan 1997 ano
10.871
+2.798
34.65%
1 jan 1998 ano
9.358
-1.513
-13.92%
1 jan 1999 ano
4.975
-4.383
-46.84%
1 jan 2000 ano
7.549
+2.574
51.74%
1 jan 2001 ano
12.897
+5.348
70.84%
1 jan 2002 ano
11.206
-1.691
-13.11%
1 jan 2003 ano
11.788
+0.583
5.2%
1 jan 2004 ano
14.201
+2.412
20.46%
1 jan 2005 ano
16.245
+2.044
14.39%
1 jan 2006 ano
21.351
+5.106
31.43%
1 jan 2007 ano
22.981
+1.63
7.64%
1 jan 2008 ano
21.672
-1.309
-5.7%
1 jan 2009 ano
23.207
+1.535
7.08%
1 jan 2010 ano
15.274
-7.933
-34.18%
1 jan 2011 ano
17.653
+2.379
15.58%
1 jan 2012 ano
20.354
+2.701
15.3%
1 jan 2013 ano
18.771
-1.583
-7.78%
1 jan 2014 ano
17.362
-1.409
-7.51%
1 jan 2015 ano
15.743
-1.619
-9.32%
1 jan 2016 ano
9.017
-6.726
-42.72%
Classificação de países por estatísticas atuais por anos


Comentários: