29
/pt/
pt
AIzaSyAYiBZKx7MnpbEhh9jyipgxe19OcubqV5w
April 1, 2024
25191
Caribbean small states
CSS
false
2
1
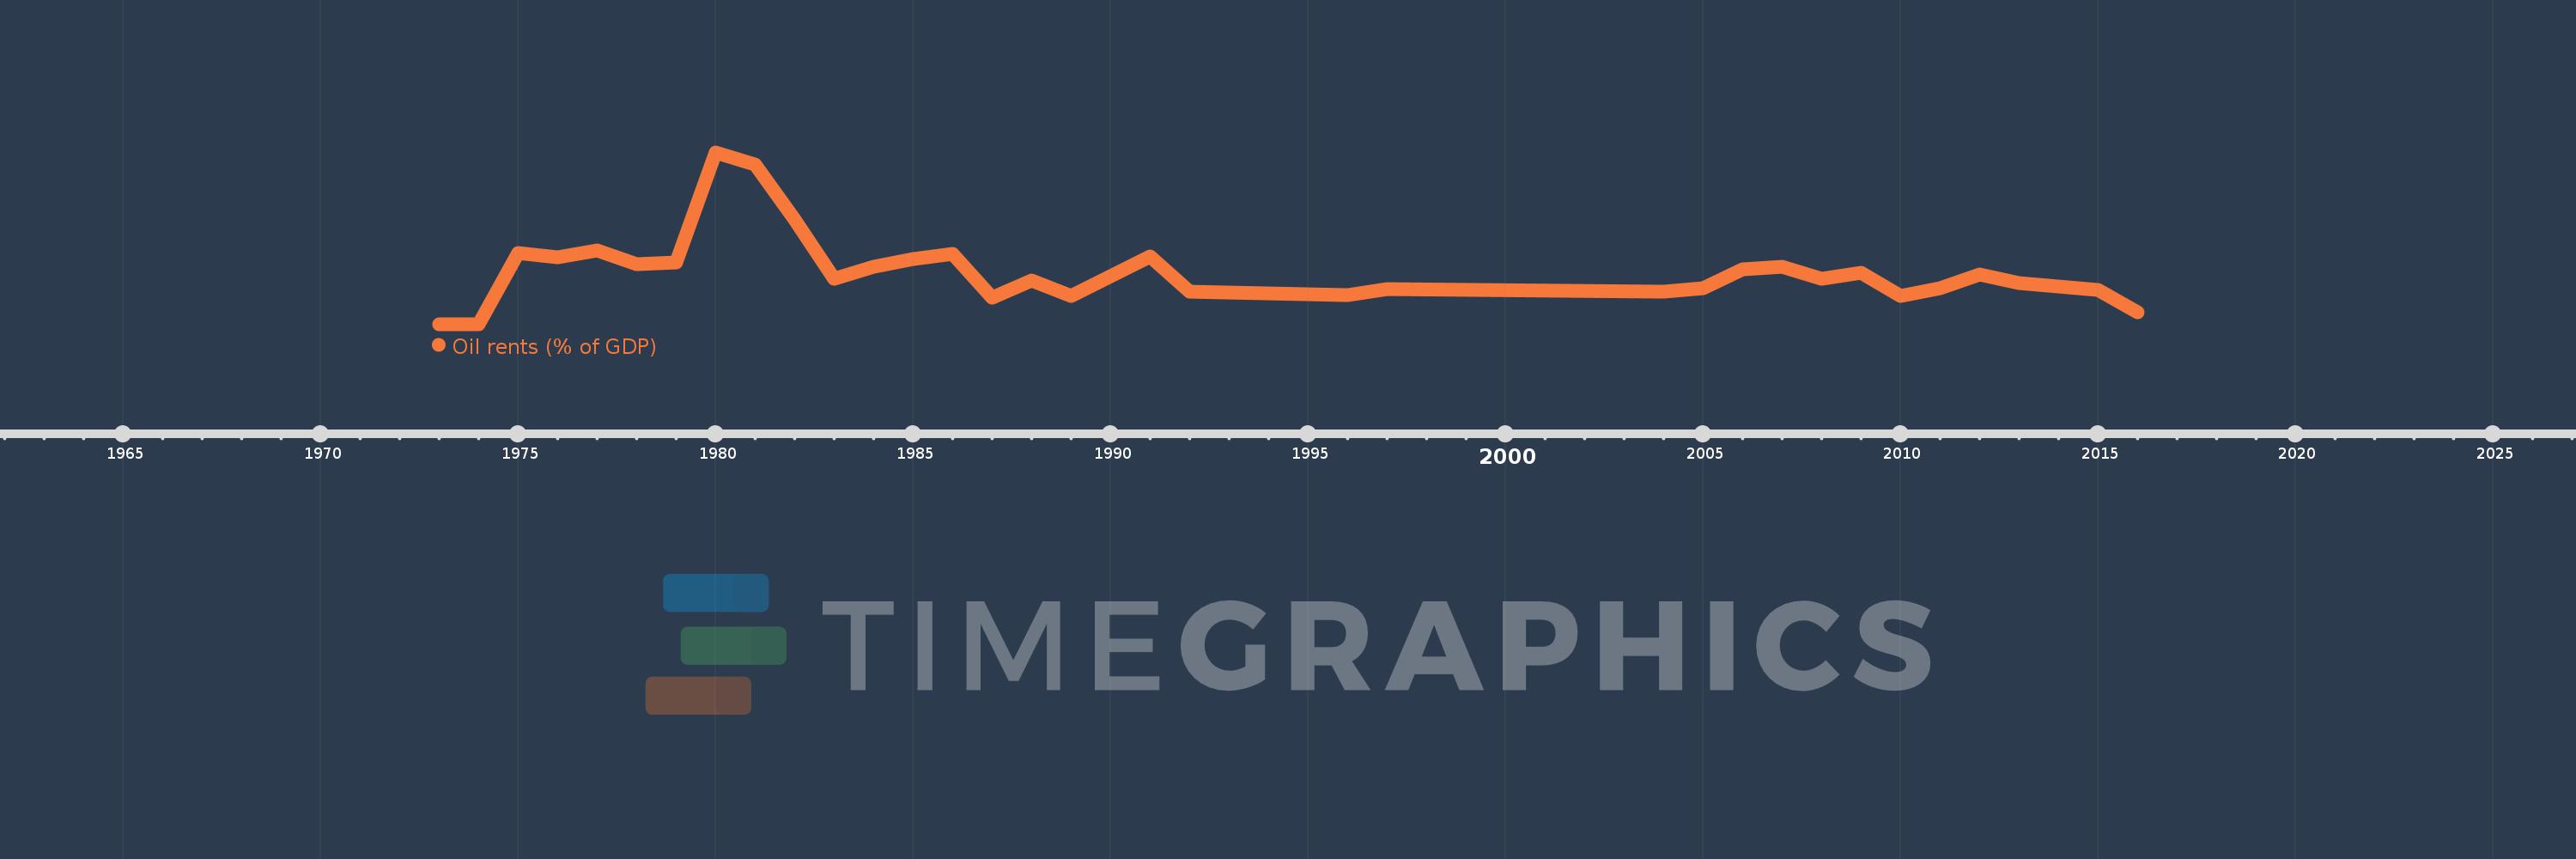
Oil rents (% of GDP)
2016,2015,2014,2013,2012,2011,2010,2009,2008,2007,2006,2005,2004,1997,1996,1992,1991,1990,1989,1988,1987,1986,1985,1984,1983,1982,1981,1980,1979,1978,1977,1976,1975,1974,1973
Estas estatísticas em outros países:
Linha do tempo:
Nesta escala de tempo está apresentado um gráfico de 1973 ano até 2016 ano Caribbean small states. Dados de 1972 ano ausente. O número de observações reais por data: 35.
Fonte (nome):
Indicadores de desenvolvimento mundial
Fonte (organização):
Estimates based on sources and methods described in "The Changing Wealth of Nations: Measuring Sustainable Development in the New Millennium" (World Bank, 2011).
Categorias:
Energy & Mining, Environment
Foi atualizado:
23 abr 2017 ano
Indicadores de alterações dos valores ao longo dos anos
Mínimo:
0.002
1 jan 1973 ano
Máximo:
18.484
1 jan 1980 ano
Na data de observação
Valor
Mudança absoluta
A alteração em relação ao valor anterior
1 jan 1973 ano
0.002
+0.002
0.0%
1 jan 1974 ano
0.025
+0.023
930.76%
1 jan 1975 ano
7.632
+7.607
29.85 mil%
1 jan 1976 ano
7.189
-0.443
-5.81%
1 jan 1977 ano
7.983
+0.794
11.05%
1 jan 1978 ano
6.494
-1.49
-18.66%
1 jan 1979 ano
6.607
+0.113
1.74%
1 jan 1980 ano
18.484
+11.878
179.78%
1 jan 1981 ano
17.187
-1.298
-7.02%
1 jan 1982 ano
11.25
-5.937
-34.54%
1 jan 1983 ano
4.904
-6.346
-56.41%
1 jan 1984 ano
6.168
+1.264
25.78%
1 jan 1985 ano
7.058
+0.889
14.42%
1 jan 1986 ano
7.543
+0.485
6.87%
1 jan 1987 ano
2.901
-4.641
-61.53%
1 jan 1988 ano
4.723
+1.821
62.77%
1 jan 1989 ano
3.024
-1.699
-35.98%
1 jan 1990 ano
5.185
+2.162
71.49%
1 jan 1991 ano
7.266
+2.081
40.13%
1 jan 1992 ano
3.525
-3.741
-51.49%
1 jan 1996 ano
3.144
-0.381
-10.8%
1 jan 1997 ano
3.802
+0.657
20.9%
1 jan 2004 ano
3.538
-0.263
-6.92%
1 jan 2005 ano
3.909
+0.371
10.47%
1 jan 2006 ano
5.868
+1.959
50.11%
1 jan 2007 ano
6.18
+0.313
5.33%
1 jan 2008 ano
4.903
-1.277
-20.67%
1 jan 2009 ano
5.499
+0.596
12.15%
1 jan 2010 ano
3.059
-2.44
-44.37%
1 jan 2011 ano
3.874
+0.815
26.64%
1 jan 2012 ano
5.31
+1.436
37.06%
1 jan 2013 ano
4.436
-0.874
-16.46%
1 jan 2014 ano
4.081
-0.355
-8.01%
1 jan 2015 ano
3.668
-0.412
-10.1%
1 jan 2016 ano
1.263
-2.405
-65.56%
Classificação de países por estatísticas atuais por anos


Comentários: