29
/pt/
pt
AIzaSyAYiBZKx7MnpbEhh9jyipgxe19OcubqV5w
April 1, 2024
33735
European Union
EUU
false
2
1
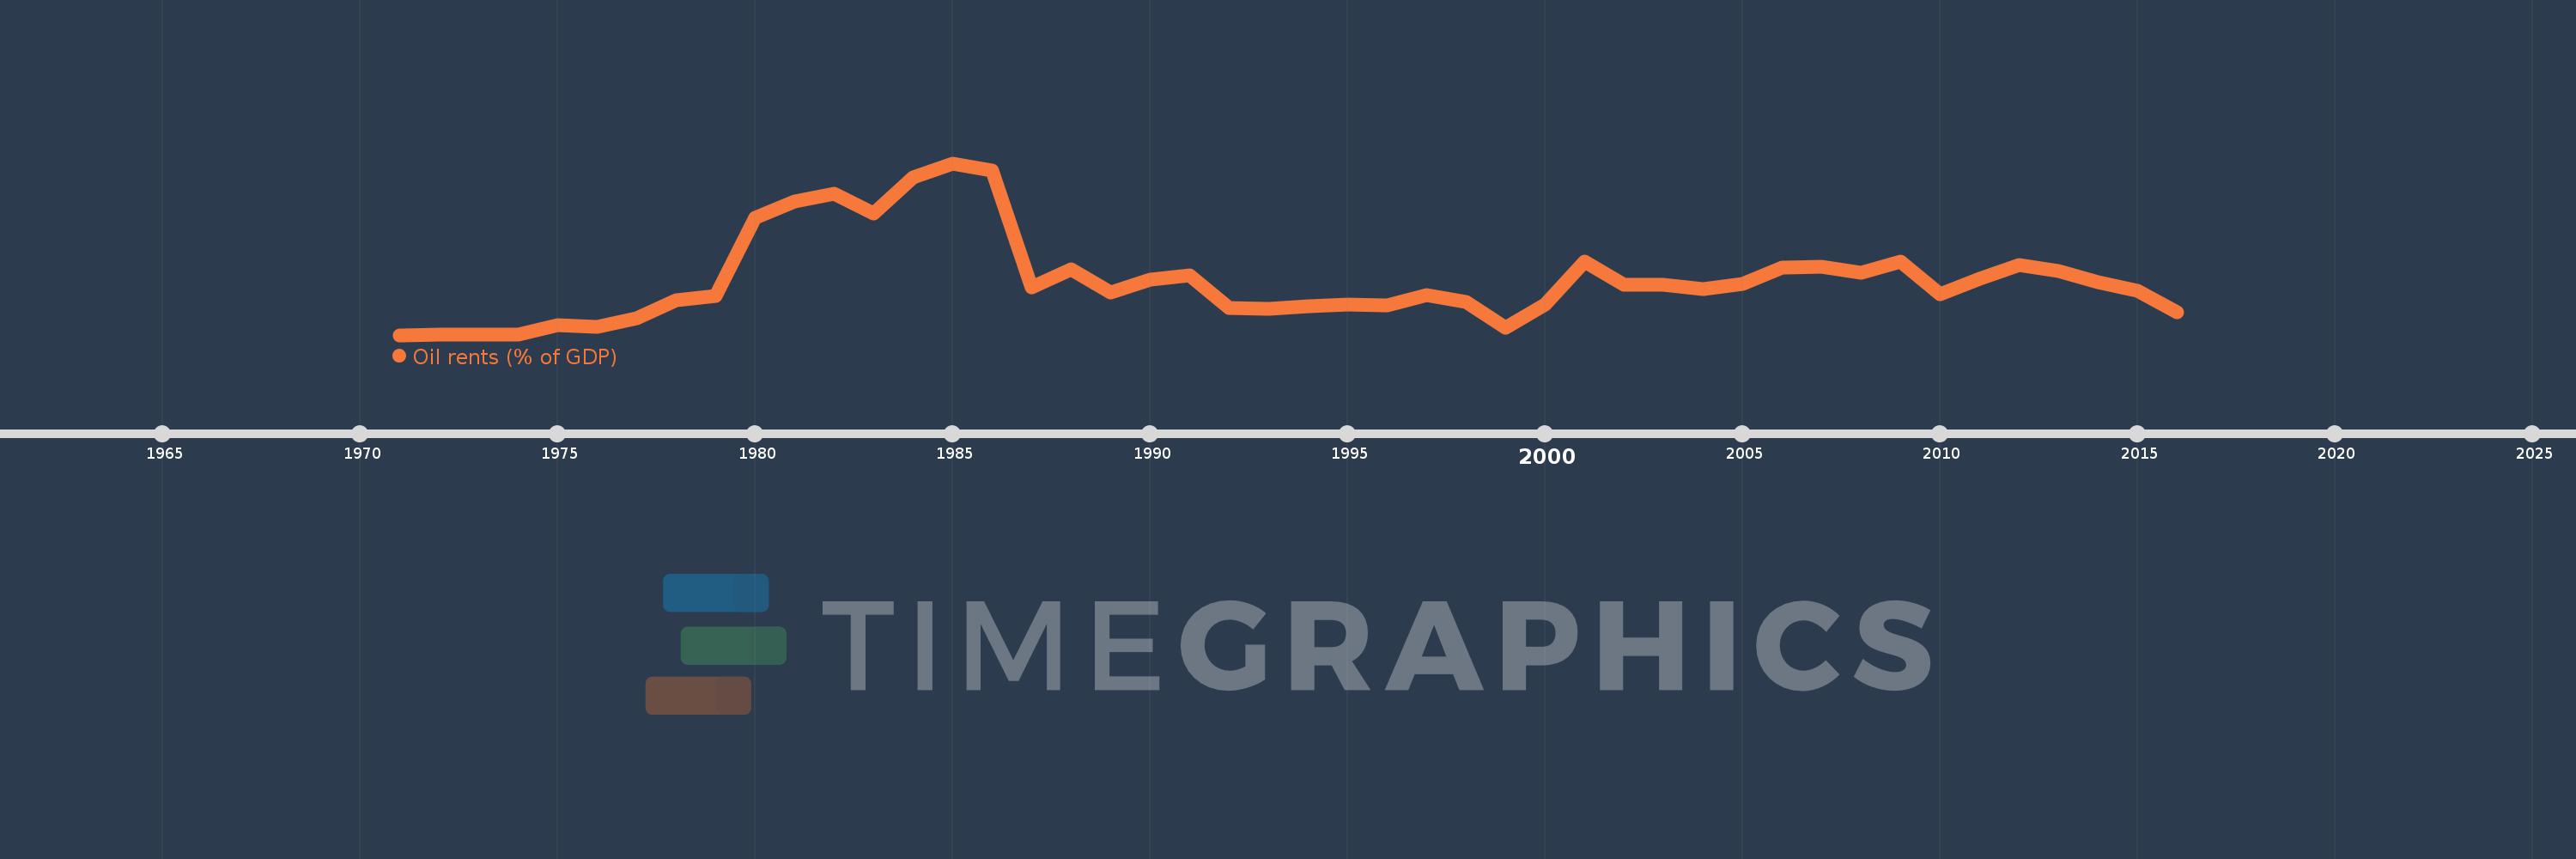
Oil rents (% of GDP)
2016,2015,2014,2013,2012,2011,2010,2009,2008,2007,2006,2005,2004,2003,2002,2001,2000,1999,1998,1997,1996,1995,1994,1993,1992,1991,1990,1989,1988,1987,1986,1985,1984,1983,1982,1981,1980,1979,1978,1977,1976,1975,1974,1973,1972,1971
Estas estatísticas em outros países:
Linha do tempo:
Nesta escala de tempo está apresentado um gráfico de 1971 ano até 2016 ano European Union. Dados de 1970 ano ausente. O número de observações reais por data: 46.
Fonte (nome):
Indicadores de desenvolvimento mundial
Fonte (organização):
Estimates based on sources and methods described in "The Changing Wealth of Nations: Measuring Sustainable Development in the New Millennium" (World Bank, 2011).
Categorias:
Energy & Mining, Environment
Foi atualizado:
23 abr 2017 ano
Indicadores de alterações dos valores ao longo dos anos
Máximo:
0.484
1 jan 1985 ano
Na data de observação
Valor
Mudança absoluta
A alteração em relação ao valor anterior
1 jan 1971 ano
0.0
+0.0
0.0%
1 jan 1972 ano
0.001
+0.0
28.24%
1 jan 1973 ano
0.001
0.0
-3.41%
1 jan 1974 ano
0.001
+0.0
22.41%
1 jan 1975 ano
0.027
+0.026
4.28 mil%
1 jan 1976 ano
0.024
-0.003
-9.39%
1 jan 1977 ano
0.048
+0.024
98.1%
1 jan 1978 ano
0.098
+0.05
103.25%
1 jan 1979 ano
0.109
+0.011
10.94%
1 jan 1980 ano
0.331
+0.223
205.39%
1 jan 1981 ano
0.376
+0.045
13.53%
1 jan 1982 ano
0.399
+0.022
5.95%
1 jan 1983 ano
0.343
-0.056
-14.07%
1 jan 1984 ano
0.443
+0.101
29.39%
1 jan 1985 ano
0.484
+0.041
9.27%
1 jan 1986 ano
0.463
-0.022
-4.46%
1 jan 1987 ano
0.135
-0.327
-70.75%
1 jan 1988 ano
0.185
+0.05
36.9%
1 jan 1989 ano
0.119
-0.067
-35.98%
1 jan 1990 ano
0.155
+0.037
30.88%
1 jan 1991 ano
0.169
+0.013
8.53%
1 jan 1992 ano
0.076
-0.093
-55.12%
1 jan 1993 ano
0.073
-0.002
-3.02%
1 jan 1994 ano
0.081
+0.008
10.56%
1 jan 1995 ano
0.085
+0.004
5.06%
1 jan 1996 ano
0.084
-0.001
-1.64%
1 jan 1997 ano
0.113
+0.03
35.36%
1 jan 1998 ano
0.094
-0.019
-17.12%
1 jan 1999 ano
0.02
-0.074
-79.0%
1 jan 2000 ano
0.086
+0.066
334.58%
1 jan 2001 ano
0.207
+0.121
140.75%
1 jan 2002 ano
0.141
-0.065
-31.52%
1 jan 2003 ano
0.141
0.0
-0.24%
1 jan 2004 ano
0.13
-0.011
-7.71%
1 jan 2005 ano
0.143
+0.013
9.99%
1 jan 2006 ano
0.19
+0.046
32.45%
1 jan 2007 ano
0.193
+0.003
1.56%
1 jan 2008 ano
0.175
-0.018
-9.34%
1 jan 2009 ano
0.208
+0.034
19.25%
1 jan 2010 ano
0.116
-0.093
-44.45%
1 jan 2011 ano
0.159
+0.043
37.29%
1 jan 2012 ano
0.197
+0.038
24.15%
1 jan 2013 ano
0.18
-0.017
-8.82%
1 jan 2014 ano
0.15
-0.03
-16.54%
1 jan 2015 ano
0.125
-0.025
-16.38%
1 jan 2016 ano
0.063
-0.063
-50.12%
Classificação de países por estatísticas atuais por anos


Comentários: