29
/pt/
pt
AIzaSyAYiBZKx7MnpbEhh9jyipgxe19OcubqV5w
April 1, 2024
31959
Europe & Central Asia (excluding high income)
ECA
false
2
1
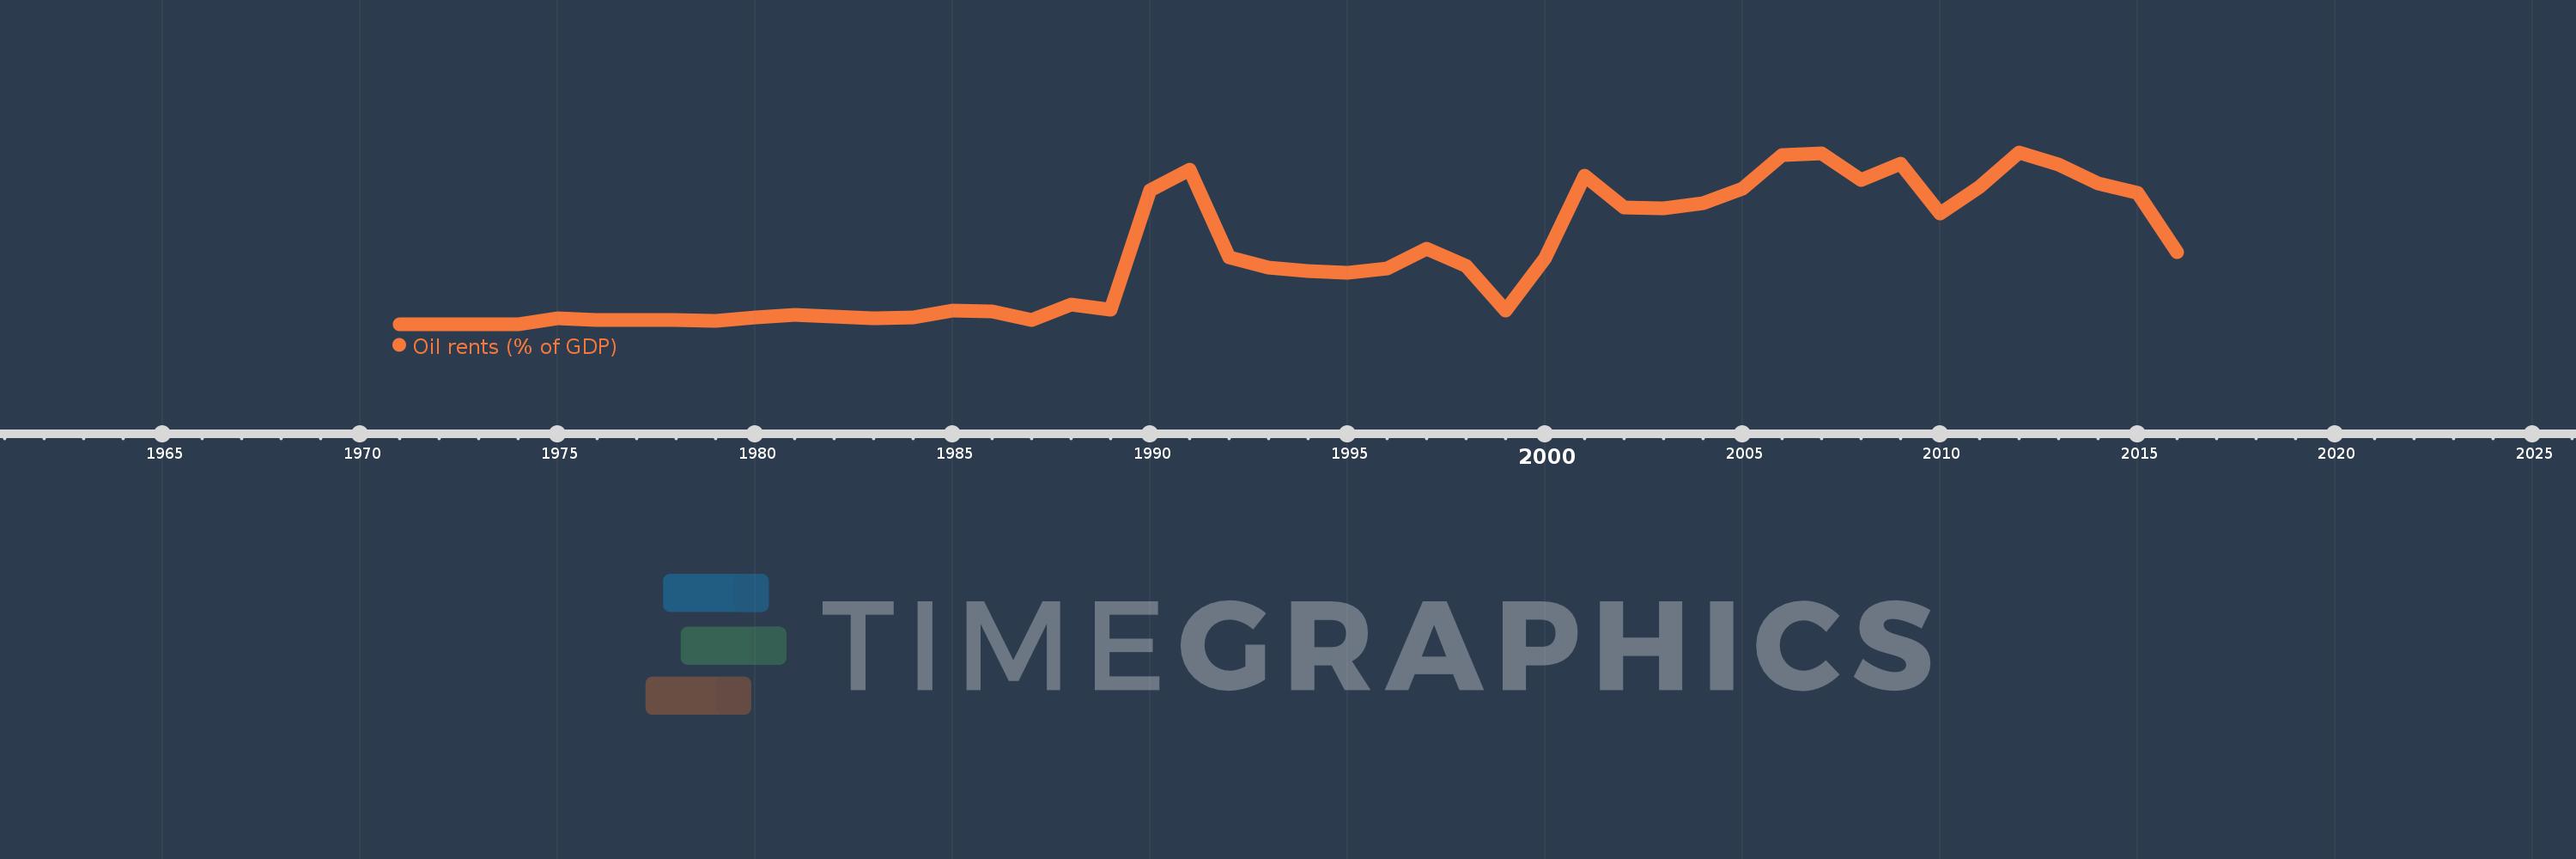
Oil rents (% of GDP)
2016,2015,2014,2013,2012,2011,2010,2009,2008,2007,2006,2005,2004,2003,2002,2001,2000,1999,1998,1997,1996,1995,1994,1993,1992,1991,1990,1989,1988,1987,1986,1985,1984,1983,1982,1981,1980,1979,1978,1977,1976,1975,1974,1973,1972,1971
Estas estatísticas em outros países:
Linha do tempo:
Nesta escala de tempo está apresentado um gráfico de 1971 ano até 2016 ano Europe & Central Asia (excluding high income). Dados de 1970 ano ausente. O número de observações reais por data: 46.
Fonte (nome):
Indicadores de desenvolvimento mundial
Fonte (organização):
Estimates based on sources and methods described in "The Changing Wealth of Nations: Measuring Sustainable Development in the New Millennium" (World Bank, 2011).
Categorias:
Energy & Mining, Environment
Foi atualizado:
23 abr 2017 ano
Indicadores de alterações dos valores ao longo dos anos
Mínimo:
0.004
1 jan 1971 ano
Máximo:
7.723
1 jan 2012 ano
Na data de observação
Valor
Mudança absoluta
A alteração em relação ao valor anterior
1 jan 1971 ano
0.004
+0.004
0.0%
1 jan 1972 ano
0.007
+0.003
81.26%
1 jan 1973 ano
0.006
0.0
-7.38%
1 jan 1974 ano
0.008
+0.002
27.3%
1 jan 1975 ano
0.253
+0.245
3.19 mil%
1 jan 1976 ano
0.192
-0.06
-23.91%
1 jan 1977 ano
0.202
+0.01
5.14%
1 jan 1978 ano
0.193
-0.009
-4.55%
1 jan 1979 ano
0.172
-0.021
-10.88%
1 jan 1980 ano
0.324
+0.152
88.13%
1 jan 1981 ano
0.414
+0.09
27.93%
1 jan 1982 ano
0.343
-0.072
-17.29%
1 jan 1983 ano
0.286
-0.057
-16.59%
1 jan 1984 ano
0.313
+0.028
9.64%
1 jan 1985 ano
0.635
+0.322
102.62%
1 jan 1986 ano
0.572
-0.063
-9.89%
1 jan 1987 ano
0.202
-0.37
-64.71%
1 jan 1988 ano
0.902
+0.7
346.93%
1 jan 1989 ano
0.655
-0.247
-27.42%
1 jan 1990 ano
6.015
+5.36
818.47%
1 jan 1991 ano
6.966
+0.951
15.82%
1 jan 1992 ano
3.005
-3.962
-56.87%
1 jan 1993 ano
2.553
-0.452
-15.05%
1 jan 1994 ano
2.387
-0.165
-6.47%
1 jan 1995 ano
2.318
-0.07
-2.92%
1 jan 1996 ano
2.522
+0.204
8.82%
1 jan 1997 ano
3.403
+0.881
34.93%
1 jan 1998 ano
2.64
-0.763
-22.41%
1 jan 1999 ano
0.604
-2.037
-77.13%
1 jan 2000 ano
2.963
+2.359
390.73%
1 jan 2001 ano
6.66
+3.697
124.78%
1 jan 2002 ano
5.246
-1.414
-21.23%
1 jan 2003 ano
5.229
-0.016
-0.31%
1 jan 2004 ano
5.453
+0.223
4.27%
1 jan 2005 ano
6.117
+0.664
12.19%
1 jan 2006 ano
7.594
+1.477
24.15%
1 jan 2007 ano
7.675
+0.08
1.06%
1 jan 2008 ano
6.485
-1.19
-15.5%
1 jan 2009 ano
7.207
+0.722
11.14%
1 jan 2010 ano
4.99
-2.217
-30.76%
1 jan 2011 ano
6.174
+1.183
23.71%
1 jan 2012 ano
7.723
+1.549
25.1%
1 jan 2013 ano
7.189
-0.534
-6.92%
1 jan 2014 ano
6.33
-0.859
-11.95%
1 jan 2015 ano
5.916
-0.414
-6.54%
1 jan 2016 ano
3.239
-2.678
-45.26%
Classificação de países por estatísticas atuais por anos


Comentários: