29
/pt/
pt
AIzaSyAYiBZKx7MnpbEhh9jyipgxe19OcubqV5w
April 1, 2024
160854
Israel
ISR
true
2
1
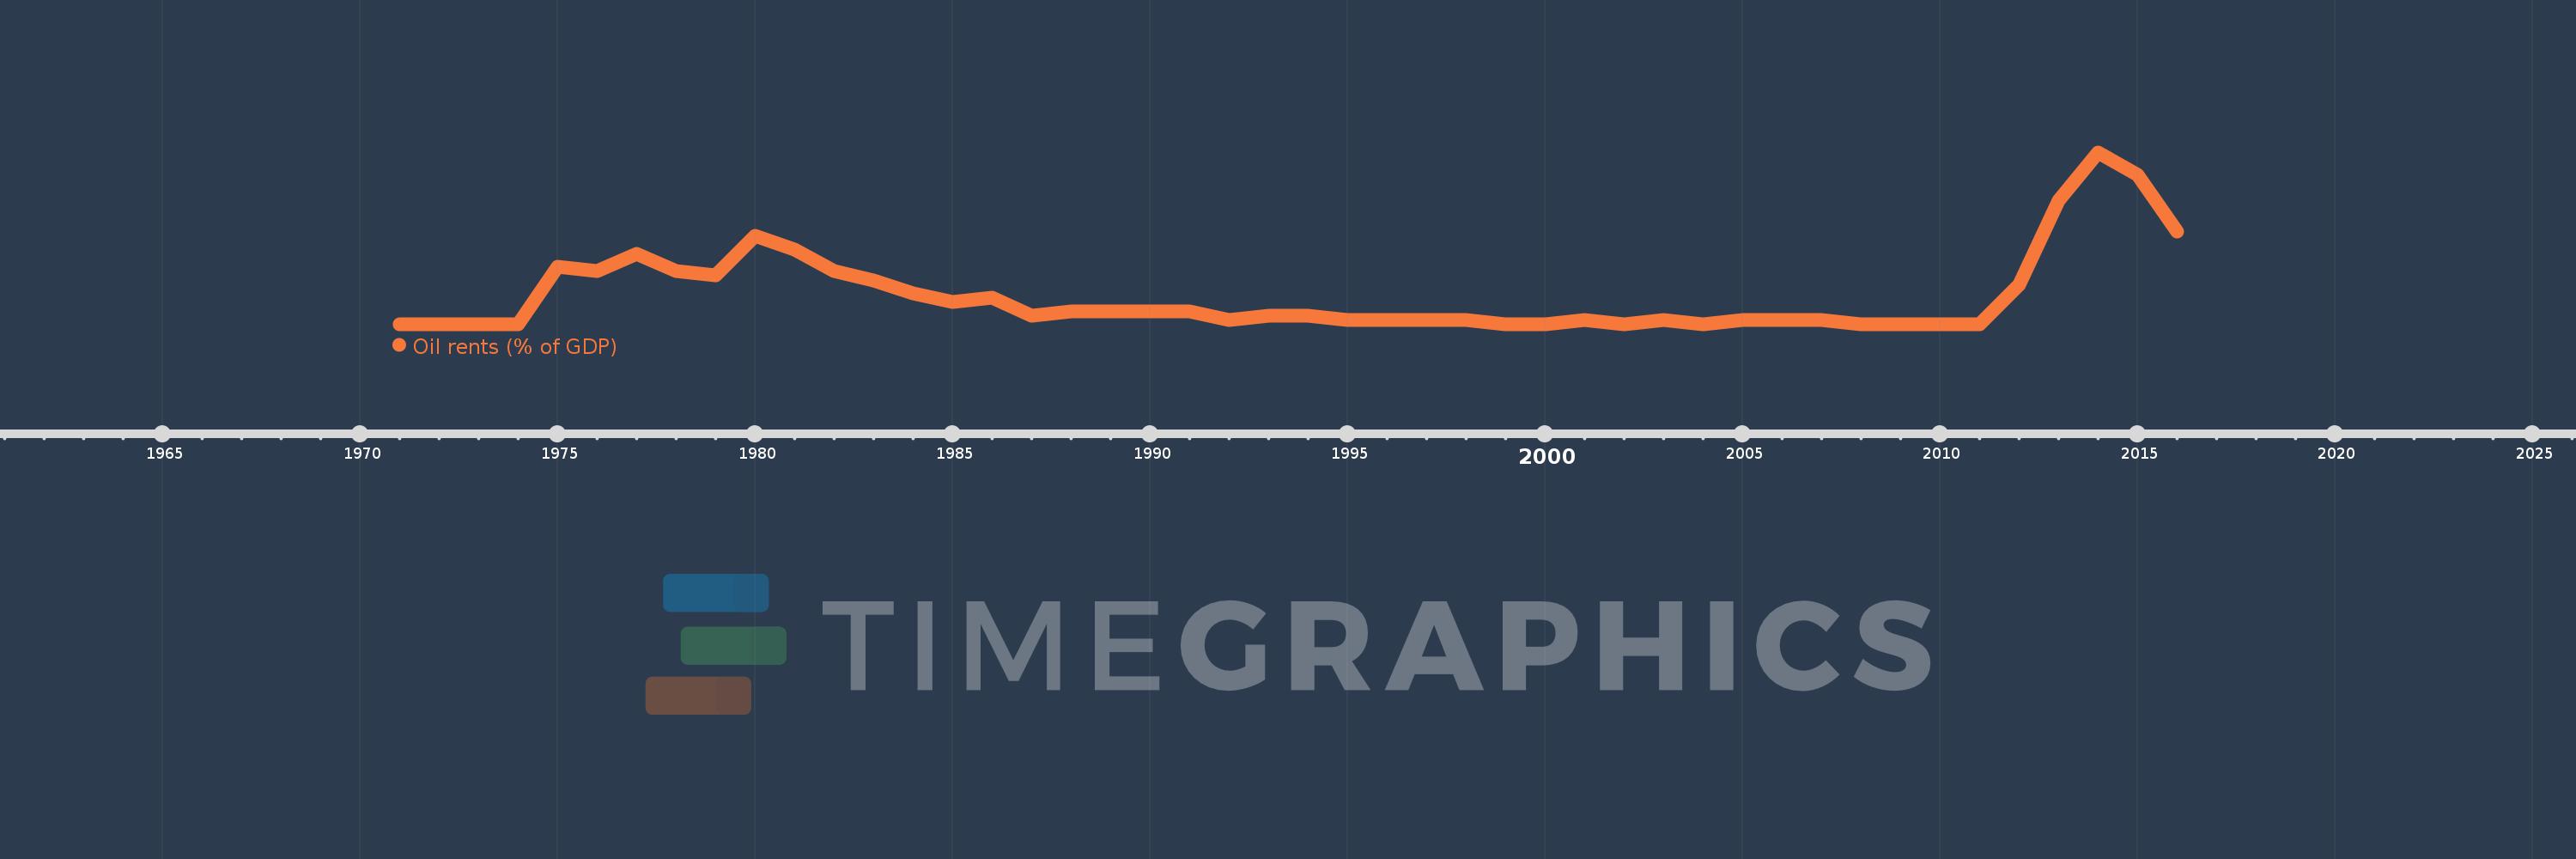
Oil rents (% of GDP)
2016,2015,2014,2013,2012,2011,2010,2009,2008,2007,2006,2005,2004,2003,2002,2001,2000,1999,1998,1997,1996,1995,1994,1993,1992,1991,1990,1989,1988,1987,1986,1985,1984,1983,1982,1981,1980,1979,1978,1977,1976,1975,1974,1973,1972,1971
Estas estatísticas em outros países:
Linha do tempo:
Nesta escala de tempo está apresentado um gráfico de 1971 ano até 2016 ano Israel. Dados de 1970 ano ausente. O número de observações reais por data: 46.
Fonte (nome):
Indicadores de desenvolvimento mundial
Fonte (organização):
Estimates based on sources and methods described in "The Changing Wealth of Nations: Measuring Sustainable Development in the New Millennium" (World Bank, 2011).
Categorias:
Energy & Mining, Environment
Foi atualizado:
23 abr 2017 ano
Indicadores de alterações dos valores ao longo dos anos
Máximo:
0.039
1 jan 2014 ano
Na data de observação
Valor
Mudança absoluta
A alteração em relação ao valor anterior
1 jan 1971 ano
0.0
+0.0
0.0%
1 jan 1972 ano
0.0
0.0
-15.15%
1 jan 1973 ano
0.0
+0.0
16.02%
1 jan 1974 ano
0.0
+0.0
116.37%
1 jan 1975 ano
0.013
+0.013
12.06 mil%
1 jan 1976 ano
0.012
-0.001
-8.36%
1 jan 1977 ano
0.016
+0.004
29.73%
1 jan 1978 ano
0.012
-0.003
-21.32%
1 jan 1979 ano
0.011
-0.002
-14.24%
1 jan 1980 ano
0.02
+0.009
87.17%
1 jan 1981 ano
0.017
-0.003
-16.71%
1 jan 1982 ano
0.012
-0.005
-30.83%
1 jan 1983 ano
0.01
-0.001
-11.45%
1 jan 1984 ano
0.007
-0.003
-27.67%
1 jan 1985 ano
0.005
-0.002
-28.93%
1 jan 1986 ano
0.006
+0.0
9.05%
1 jan 1987 ano
0.002
-0.003
-59.93%
1 jan 1988 ano
0.003
+0.001
51.57%
1 jan 1989 ano
0.003
-0.001
-17.34%
1 jan 1990 ano
0.003
+0.001
21.15%
1 jan 1991 ano
0.003
0.0
-6.28%
1 jan 1992 ano
0.001
-0.002
-54.47%
1 jan 1993 ano
0.002
+0.0
2.26%
1 jan 1994 ano
0.002
+0.001
47.0%
1 jan 1995 ano
0.001
-0.001
-41.26%
1 jan 1996 ano
0.001
0.0
-37.82%
1 jan 1997 ano
0.001
0.0
-12.31%
1 jan 1998 ano
0.001
0.0
-20.68%
1 jan 1999 ano
0.0
0.0
-38.78%
1 jan 2000 ano
0.0
+0.0
18.92%
1 jan 2001 ano
0.001
+0.0
30.08%
1 jan 2002 ano
0.0
0.0
-29.74%
1 jan 2003 ano
0.001
+0.0
35.28%
1 jan 2004 ano
0.0
0.0
-6.59%
1 jan 2005 ano
0.001
+0.0
6.61%
1 jan 2006 ano
0.001
+0.0
36.29%
1 jan 2007 ano
0.001
0.0
-7.48%
1 jan 2008 ano
0.0
0.0
-75.63%
1 jan 2009 ano
0.0
+0.0
120.77%
1 jan 2010 ano
0.0
0.0
-41.51%
1 jan 2011 ano
0.0
+0.0
20.37%
1 jan 2012 ano
0.009
+0.008
3.49 mil%
1 jan 2013 ano
0.028
+0.019
219.77%
1 jan 2014 ano
0.039
+0.011
41.21%
1 jan 2015 ano
0.034
-0.006
-14.07%
1 jan 2016 ano
0.021
-0.013
-38.69%
Classificação de países por estatísticas atuais por anos


Comentários: