29
/pt/
pt
AIzaSyAYiBZKx7MnpbEhh9jyipgxe19OcubqV5w
April 1, 2024
65368
Albania
ALB
true
2
1
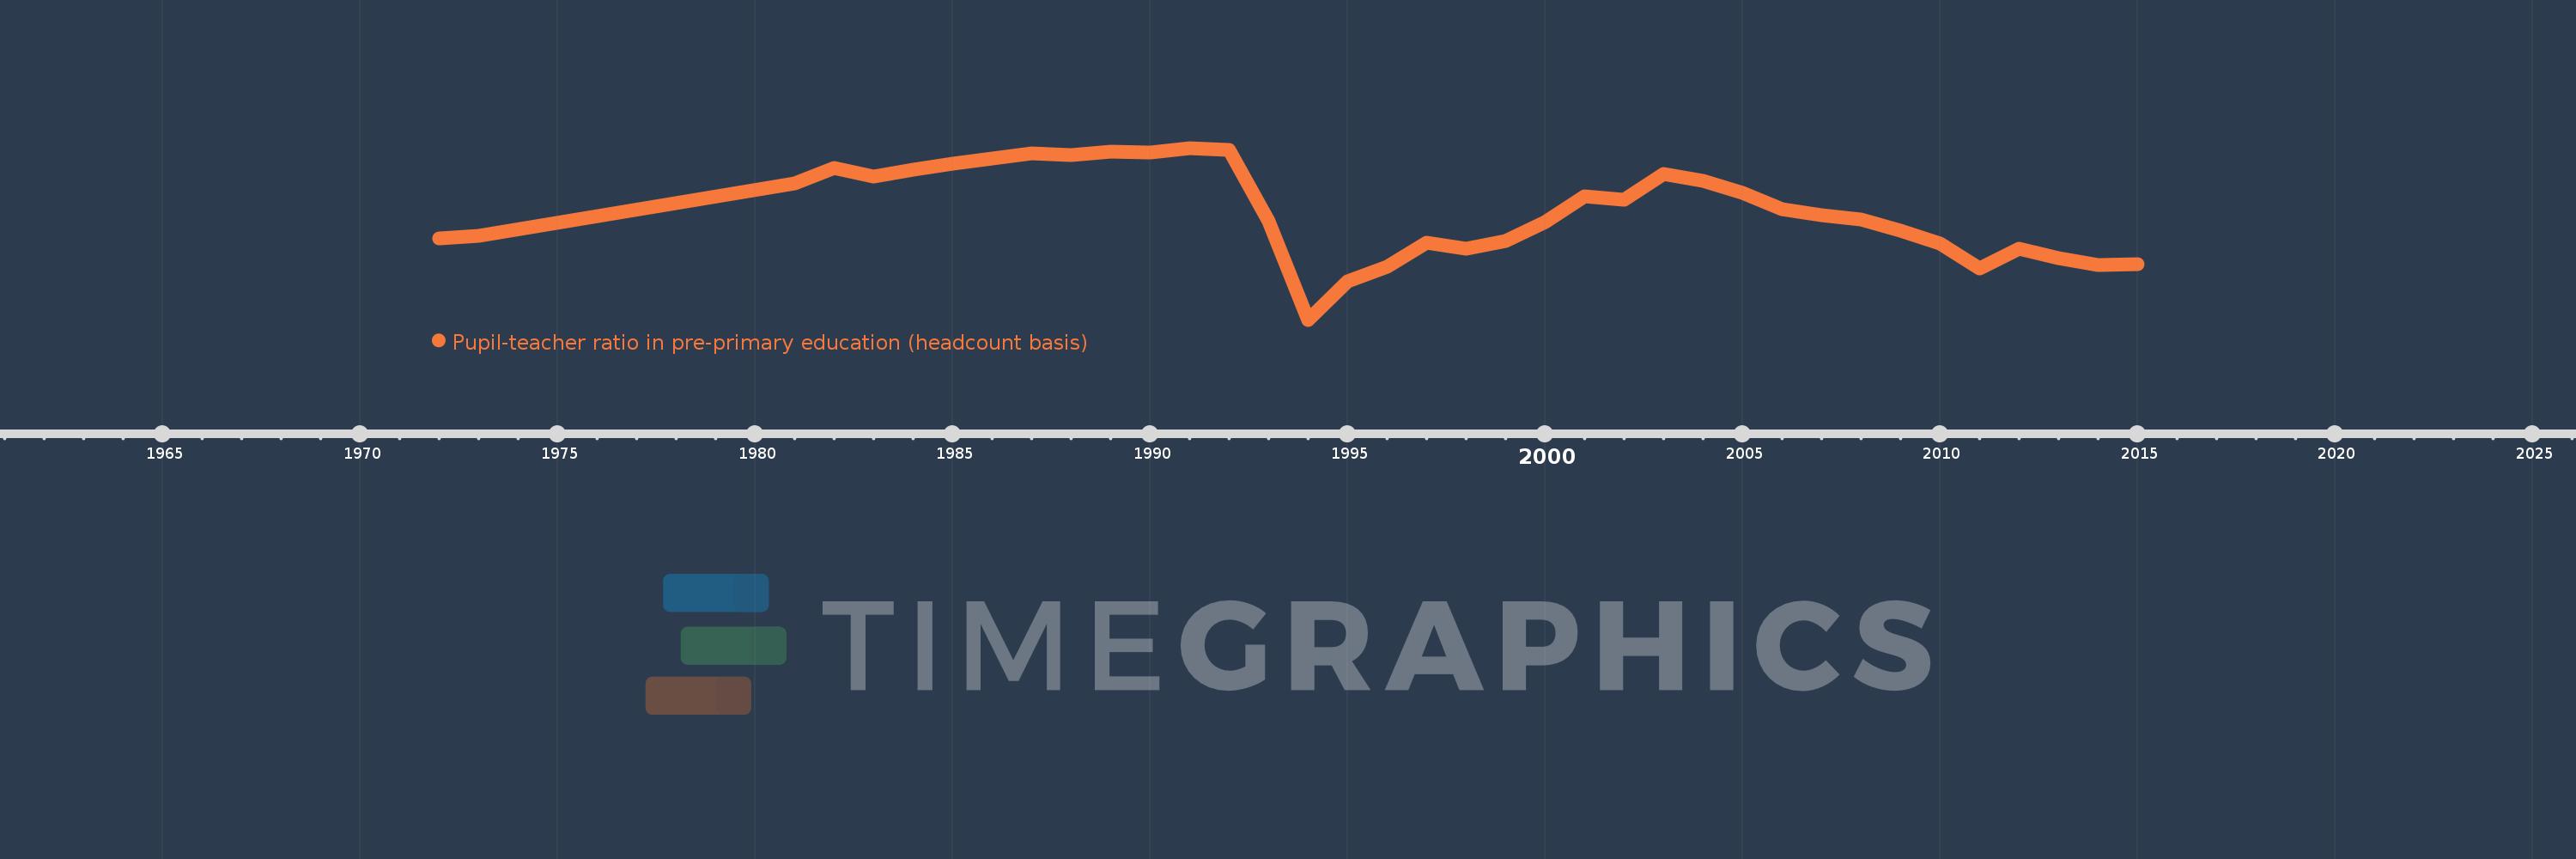
Pupil-teacher ratio in pre-primary education (headcount basis)
2015,2014,2013,2012,2011,2010,2009,2008,2007,2006,2005,2004,2003,2002,2001,2000,1999,1998,1997,1996,1995,1994,1993,1992,1991,1990,1989,1988,1987,1986,1985,1984,1983,1982,1981,1973,1972
Estas estatísticas em outros países:
AfghanistanAlbaniaAlgeriaAndorraAngolaAntigua and BarbudaArab WorldArgentinaArmeniaArubaAustriaAzerbaijanBahamas, TheBahrainBangladeshBarbadosBelarusBelgiumBelizeBeninBermudaBhutanBoliviaBosnia and HerzegovinaBotswanaBrazilBritish Virgin IslandsBrunei DarussalamBulgariaBurkina FasoBurundiCabo VerdeCambodiaCameroonCanadaCaribbean small statesCayman IslandsCentral African RepublicCentral Europe and the BalticsChadChileChinaColombiaComorosCongo, Dem. Rep.Congo, Rep.Costa RicaCote d'IvoireCroatiaCubaCyprusCzech RepublicDenmarkDjiboutiDominicaDominican RepublicEarly-demographic dividendEast Asia & PacificEast Asia & Pacific (excluding high income)East Asia & Pacific (IDA & IBRD countries)EcuadorEgypt, Arab Rep.El SalvadorEquatorial GuineaEritreaEstoniaEthiopiaEuro areaEurope & Central AsiaEurope & Central Asia (excluding high income)Europe & Central Asia (IDA & IBRD countries)European UnionFijiFinlandFragile and conflict affected situationsFranceGabonGambia, TheGeorgiaGermanyGhanaGibraltarGreeceGrenadaGuatemalaGuineaGuinea-BissauGuyanaHaitiHeavily indebted poor countries (HIPC)High incomeHondurasHong Kong SAR, ChinaHungaryIBRD onlyIcelandIDA & IBRD totalIDA blendIDA onlyIDA totalIndiaIndonesiaIran, Islamic Rep.IraqIrelandIsraelItalyJamaicaJapanJordanKazakhstanKenyaKorea, Dem. People’s Rep.Korea, Rep.KuwaitKyrgyz RepublicLao PDRLate-demographic dividendLatin America & Caribbean Latin America & Caribbean (excluding high income)Latin America & the Caribbean (IDA & IBRD countries)LatviaLeast developed countries: UN classificationLebanonLesothoLiberiaLibyaLiechtensteinLithuaniaLow & middle incomeLow incomeLower middle incomeLuxembourgMacao SAR, ChinaMacedonia, FYRMadagascarMalaysiaMaldivesMaliMaltaMarshall IslandsMauritaniaMauritiusMexicoMiddle East & North AfricaMiddle East & North Africa (excluding high income)Middle East & North Africa (IDA & IBRD countries)Middle incomeMoldovaMonacoMongoliaMontenegroMoroccoMozambiqueMyanmarNamibiaNauruNepalNetherlandsNew ZealandNicaraguaNigerNigeriaNorth AmericaNorwayOECD membersOmanOther small statesPacific island small statesPalauPanamaPapua New GuineaParaguayPeruPhilippinesPolandPortugalPost-demographic dividendPre-demographic dividendPuerto RicoQatarRomaniaRussian FederationRwandaSamoaSan MarinoSao Tome and PrincipeSaudi ArabiaSenegalSerbiaSeychellesSierra LeoneSingaporeSlovak RepublicSloveniaSmall statesSolomon IslandsSomaliaSouth AfricaSouth AsiaSouth Asia (IDA & IBRD)South SudanSpainSt. Kitts and NevisSt. LuciaSt. Vincent and the GrenadinesSub-Saharan Africa Sub-Saharan Africa (excluding high income)Sub-Saharan Africa (IDA & IBRD countries)SudanSurinameSwazilandSwedenSwitzerlandSyrian Arab RepublicTajikistanTanzaniaThailandTimor-LesteTogoTongaTrinidad and TobagoTunisiaTurkeyTurks and Caicos IslandsTuvaluUgandaUkraineUnited Arab EmiratesUnited KingdomUnited StatesUpper middle incomeUruguayUzbekistanVanuatuVenezuela, RBVietnamWest Bank and GazaWorldYemen, Rep.Zimbabwe Linha do tempo:
Nesta escala de tempo está apresentado um gráfico de 1972 ano até 2015 ano Albania. Dados de 1971 ano ausente. O número de observações reais por data: 37.
Fonte (nome):
Indicadores de desenvolvimento mundial
Fonte (organização):
UNESCO Institute for Statistics
Categorias:
Education
Foi atualizado:
23 abr 2017 ano
Indicadores de alterações dos valores ao longo dos anos
Mínimo:
15.965
1 jan 1994 ano
Máximo:
23.035
1 jan 1991 ano
Na data de observação
Valor
Mudança absoluta
A alteração em relação ao valor anterior
1 jan 1972 ano
19.319
+19.319
0.0%
1 jan 1973 ano
19.435
+0.116
0.6%
1 jan 1981 ano
21.586
+2.151
11.07%
1 jan 1982 ano
22.222
+0.636
2.95%
1 jan 1983 ano
21.849
-0.374
-1.68%
1 jan 1984 ano
22.125
+0.276
1.26%
1 jan 1985 ano
22.391
+0.266
1.2%
1 jan 1986 ano
22.607
+0.215
0.96%
1 jan 1987 ano
22.805
+0.198
0.88%
1 jan 1988 ano
22.745
-0.059
-0.26%
1 jan 1989 ano
22.873
+0.128
0.56%
1 jan 1990 ano
22.834
-0.039
-0.17%
1 jan 1991 ano
23.035
+0.201
0.88%
1 jan 1992 ano
22.953
-0.082
-0.36%
1 jan 1993 ano
20.016
-2.937
-12.79%
1 jan 1994 ano
15.965
-4.052
-20.24%
1 jan 1995 ano
17.561
+1.596
10.0%
1 jan 1996 ano
18.154
+0.592
3.37%
1 jan 1997 ano
19.143
+0.99
5.45%
1 jan 1998 ano
18.873
-0.27
-1.41%
1 jan 1999 ano
19.218
+0.345
1.83%
1 jan 2000 ano
19.974
+0.756
3.93%
1 jan 2001 ano
21.041
+1.067
5.34%
1 jan 2002 ano
20.902
-0.139
-0.66%
1 jan 2003 ano
21.981
+1.08
5.16%
1 jan 2004 ano
21.67
-0.311
-1.41%
1 jan 2005 ano
21.178
-0.492
-2.27%
1 jan 2006 ano
20.522
-0.656
-3.1%
1 jan 2007 ano
20.264
-0.258
-1.26%
1 jan 2008 ano
20.085
-0.179
-0.88%
1 jan 2009 ano
19.644
-0.441
-2.2%
1 jan 2010 ano
19.105
-0.539
-2.75%
1 jan 2011 ano
18.078
-1.027
-5.38%
1 jan 2012 ano
18.875
+0.798
4.41%
1 jan 2013 ano
18.507
-0.368
-1.95%
1 jan 2014 ano
18.2
-0.307
-1.66%
1 jan 2015 ano
18.254
+0.053
0.29%
Classificação de países por estatísticas atuais por anos


Comentários: