29
/pt/
pt
AIzaSyAYiBZKx7MnpbEhh9jyipgxe19OcubqV5w
April 1, 2024
58487
South Asia (IDA & IBRD)
TSA
false
2
1
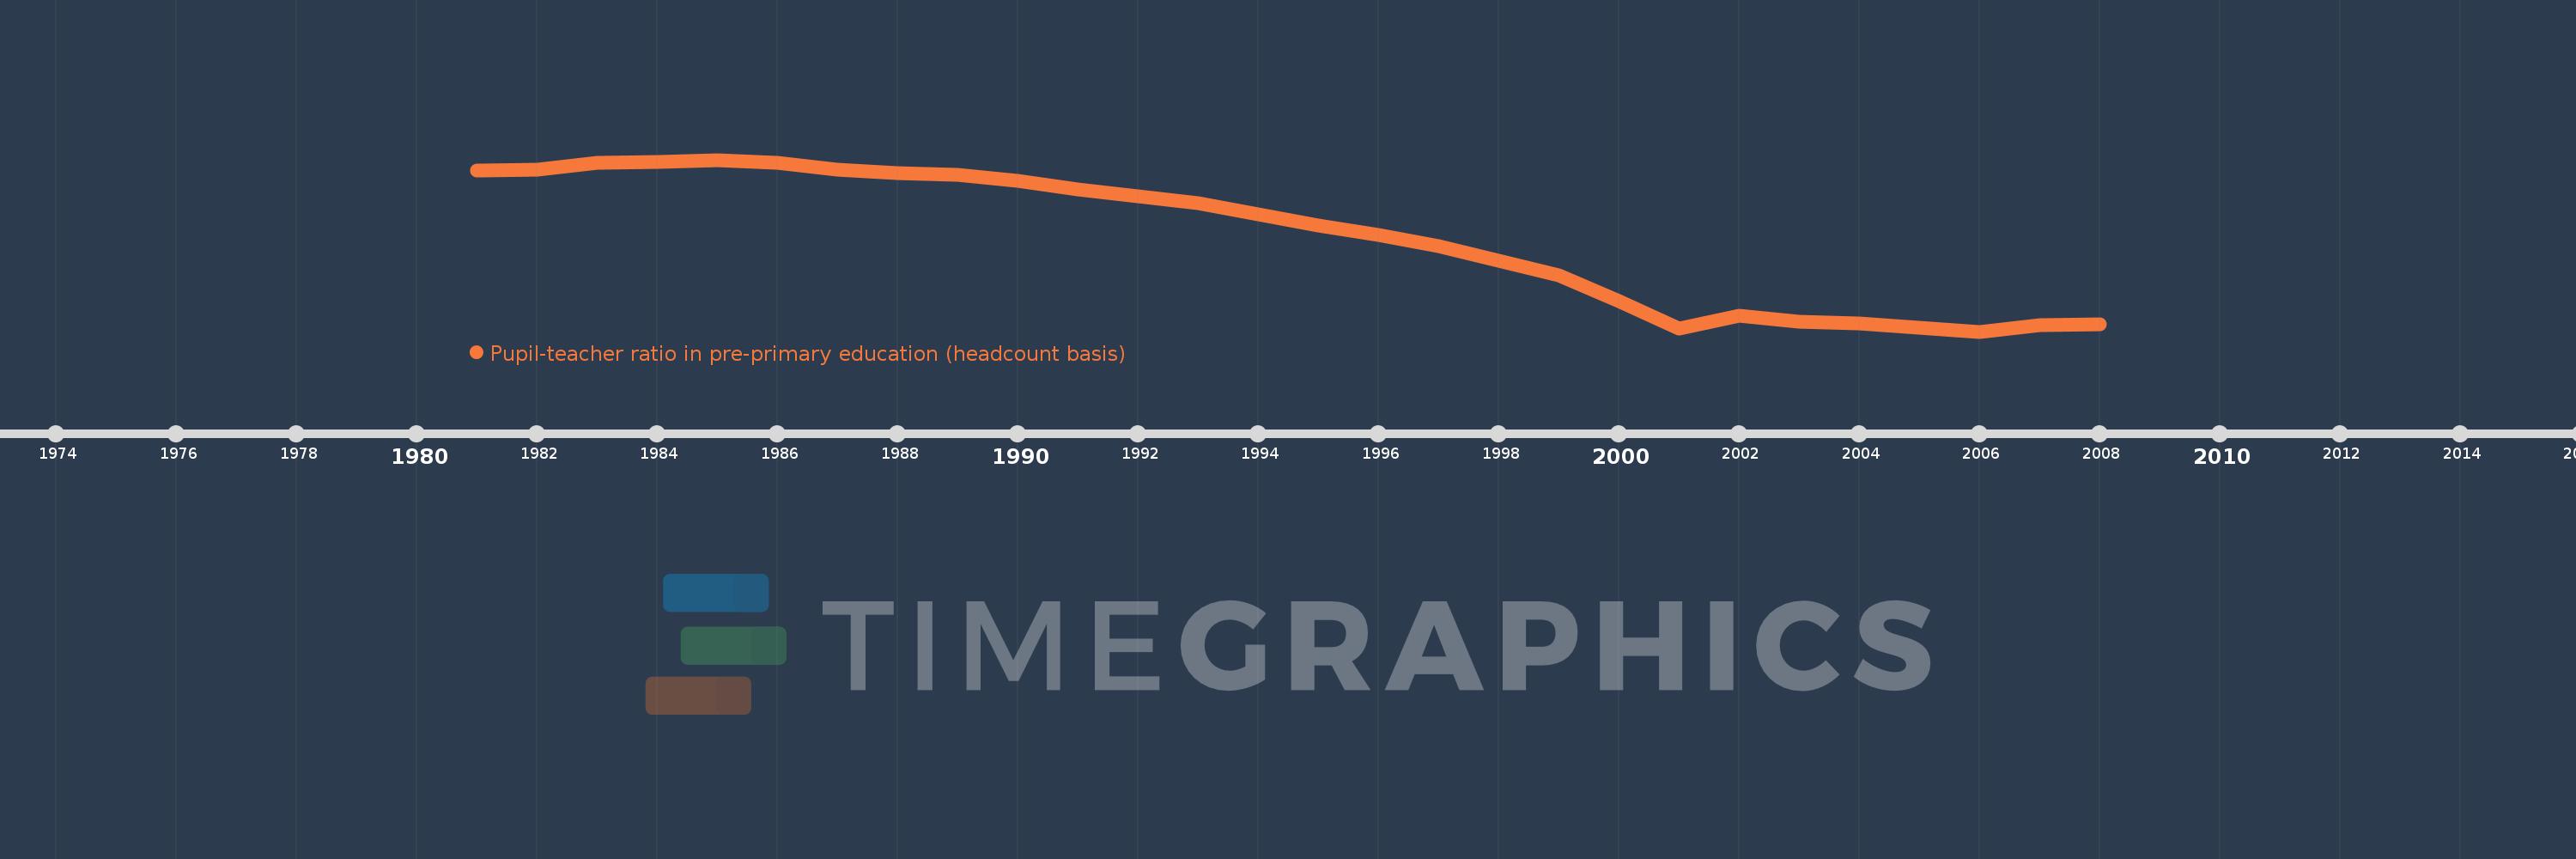
Pupil-teacher ratio in pre-primary education (headcount basis)
2008,2007,2006,2005,2004,2003,2002,2001,2000,1999,1998,1997,1996,1995,1994,1993,1992,1991,1990,1989,1988,1987,1986,1985,1984,1983,1982,1981
Estas estatísticas em outros países:
AfghanistanAlbaniaAlgeriaAndorraAngolaAntigua and BarbudaArab WorldArgentinaArmeniaArubaAustriaAzerbaijanBahamas, TheBahrainBangladeshBarbadosBelarusBelgiumBelizeBeninBermudaBhutanBoliviaBosnia and HerzegovinaBotswanaBrazilBritish Virgin IslandsBrunei DarussalamBulgariaBurkina FasoBurundiCabo VerdeCambodiaCameroonCanadaCaribbean small statesCayman IslandsCentral African RepublicCentral Europe and the BalticsChadChileChinaColombiaComorosCongo, Dem. Rep.Congo, Rep.Costa RicaCote d'IvoireCroatiaCubaCyprusCzech RepublicDenmarkDjiboutiDominicaDominican RepublicEarly-demographic dividendEast Asia & PacificEast Asia & Pacific (excluding high income)East Asia & Pacific (IDA & IBRD countries)EcuadorEgypt, Arab Rep.El SalvadorEquatorial GuineaEritreaEstoniaEthiopiaEuro areaEurope & Central AsiaEurope & Central Asia (excluding high income)Europe & Central Asia (IDA & IBRD countries)European UnionFijiFinlandFragile and conflict affected situationsFranceGabonGambia, TheGeorgiaGermanyGhanaGibraltarGreeceGrenadaGuatemalaGuineaGuinea-BissauGuyanaHaitiHeavily indebted poor countries (HIPC)High incomeHondurasHong Kong SAR, ChinaHungaryIBRD onlyIcelandIDA & IBRD totalIDA blendIDA onlyIDA totalIndiaIndonesiaIran, Islamic Rep.IraqIrelandIsraelItalyJamaicaJapanJordanKazakhstanKenyaKorea, Dem. People’s Rep.Korea, Rep.KuwaitKyrgyz RepublicLao PDRLate-demographic dividendLatin America & Caribbean Latin America & Caribbean (excluding high income)Latin America & the Caribbean (IDA & IBRD countries)LatviaLeast developed countries: UN classificationLebanonLesothoLiberiaLibyaLiechtensteinLithuaniaLow & middle incomeLow incomeLower middle incomeLuxembourgMacao SAR, ChinaMacedonia, FYRMadagascarMalaysiaMaldivesMaliMaltaMarshall IslandsMauritaniaMauritiusMexicoMiddle East & North AfricaMiddle East & North Africa (excluding high income)Middle East & North Africa (IDA & IBRD countries)Middle incomeMoldovaMonacoMongoliaMontenegroMoroccoMozambiqueMyanmarNamibiaNauruNepalNetherlandsNew ZealandNicaraguaNigerNigeriaNorth AmericaNorwayOECD membersOmanOther small statesPacific island small statesPalauPanamaPapua New GuineaParaguayPeruPhilippinesPolandPortugalPost-demographic dividendPre-demographic dividendPuerto RicoQatarRomaniaRussian FederationRwandaSamoaSan MarinoSao Tome and PrincipeSaudi ArabiaSenegalSerbiaSeychellesSierra LeoneSingaporeSlovak RepublicSloveniaSmall statesSolomon IslandsSomaliaSouth AfricaSouth AsiaSouth Asia (IDA & IBRD)South SudanSpainSt. Kitts and NevisSt. LuciaSt. Vincent and the GrenadinesSub-Saharan Africa Sub-Saharan Africa (excluding high income)Sub-Saharan Africa (IDA & IBRD countries)SudanSurinameSwazilandSwedenSwitzerlandSyrian Arab RepublicTajikistanTanzaniaThailandTimor-LesteTogoTongaTrinidad and TobagoTunisiaTurkeyTurks and Caicos IslandsTuvaluUgandaUkraineUnited Arab EmiratesUnited KingdomUnited StatesUpper middle incomeUruguayUzbekistanVanuatuVenezuela, RBVietnamWest Bank and GazaWorldYemen, Rep.Zimbabwe Linha do tempo:
Nesta escala de tempo está apresentado um gráfico de 1981 ano até 2008 ano South Asia (IDA & IBRD). Dados de 1980 ano ausente. O número de observações reais por data: 28.
Fonte (nome):
Indicadores de desenvolvimento mundial
Fonte (organização):
UNESCO Institute for Statistics
Categorias:
Education
Foi atualizado:
23 abr 2017 ano
Indicadores de alterações dos valores ao longo dos anos
Mínimo:
11.018
1 jan 2006 ano
Máximo:
35.56
1 jan 1985 ano
Na data de observação
Valor
Mudança absoluta
A alteração em relação ao valor anterior
1 jan 1981 ano
34.08
+34.08
0.0%
1 jan 1982 ano
34.207
+0.127
0.37%
1 jan 1983 ano
35.118
+0.911
2.66%
1 jan 1984 ano
35.27
+0.151
0.43%
1 jan 1985 ano
35.56
+0.29
0.82%
1 jan 1986 ano
35.115
-0.444
-1.25%
1 jan 1987 ano
34.174
-0.941
-2.68%
1 jan 1988 ano
33.661
-0.513
-1.5%
1 jan 1989 ano
33.367
-0.293
-0.87%
1 jan 1990 ano
32.506
-0.861
-2.58%
1 jan 1991 ano
31.277
-1.229
-3.78%
1 jan 1992 ano
30.398
-0.879
-2.81%
1 jan 1993 ano
29.36
-1.038
-3.41%
1 jan 1994 ano
27.741
-1.619
-5.51%
1 jan 1995 ano
26.137
-1.604
-5.78%
1 jan 1996 ano
24.88
-1.257
-4.81%
1 jan 1997 ano
23.199
-1.681
-6.75%
1 jan 1998 ano
21.093
-2.107
-9.08%
1 jan 1999 ano
19.032
-2.061
-9.77%
1 jan 2000 ano
15.408
-3.623
-19.04%
1 jan 2001 ano
11.483
-3.925
-25.48%
1 jan 2002 ano
13.27
+1.787
15.56%
1 jan 2003 ano
12.404
-0.866
-6.52%
1 jan 2004 ano
12.202
-0.202
-1.63%
1 jan 2005 ano
11.585
-0.617
-5.06%
1 jan 2006 ano
11.018
-0.567
-4.9%
1 jan 2007 ano
11.887
+0.869
7.89%
1 jan 2008 ano
12.014
+0.127
1.07%
Classificação de países por estatísticas atuais por anos


Comentários: