29
/pt/
pt
AIzaSyAYiBZKx7MnpbEhh9jyipgxe19OcubqV5w
April 1, 2024
238686
Seychelles
SYC
true
2
1
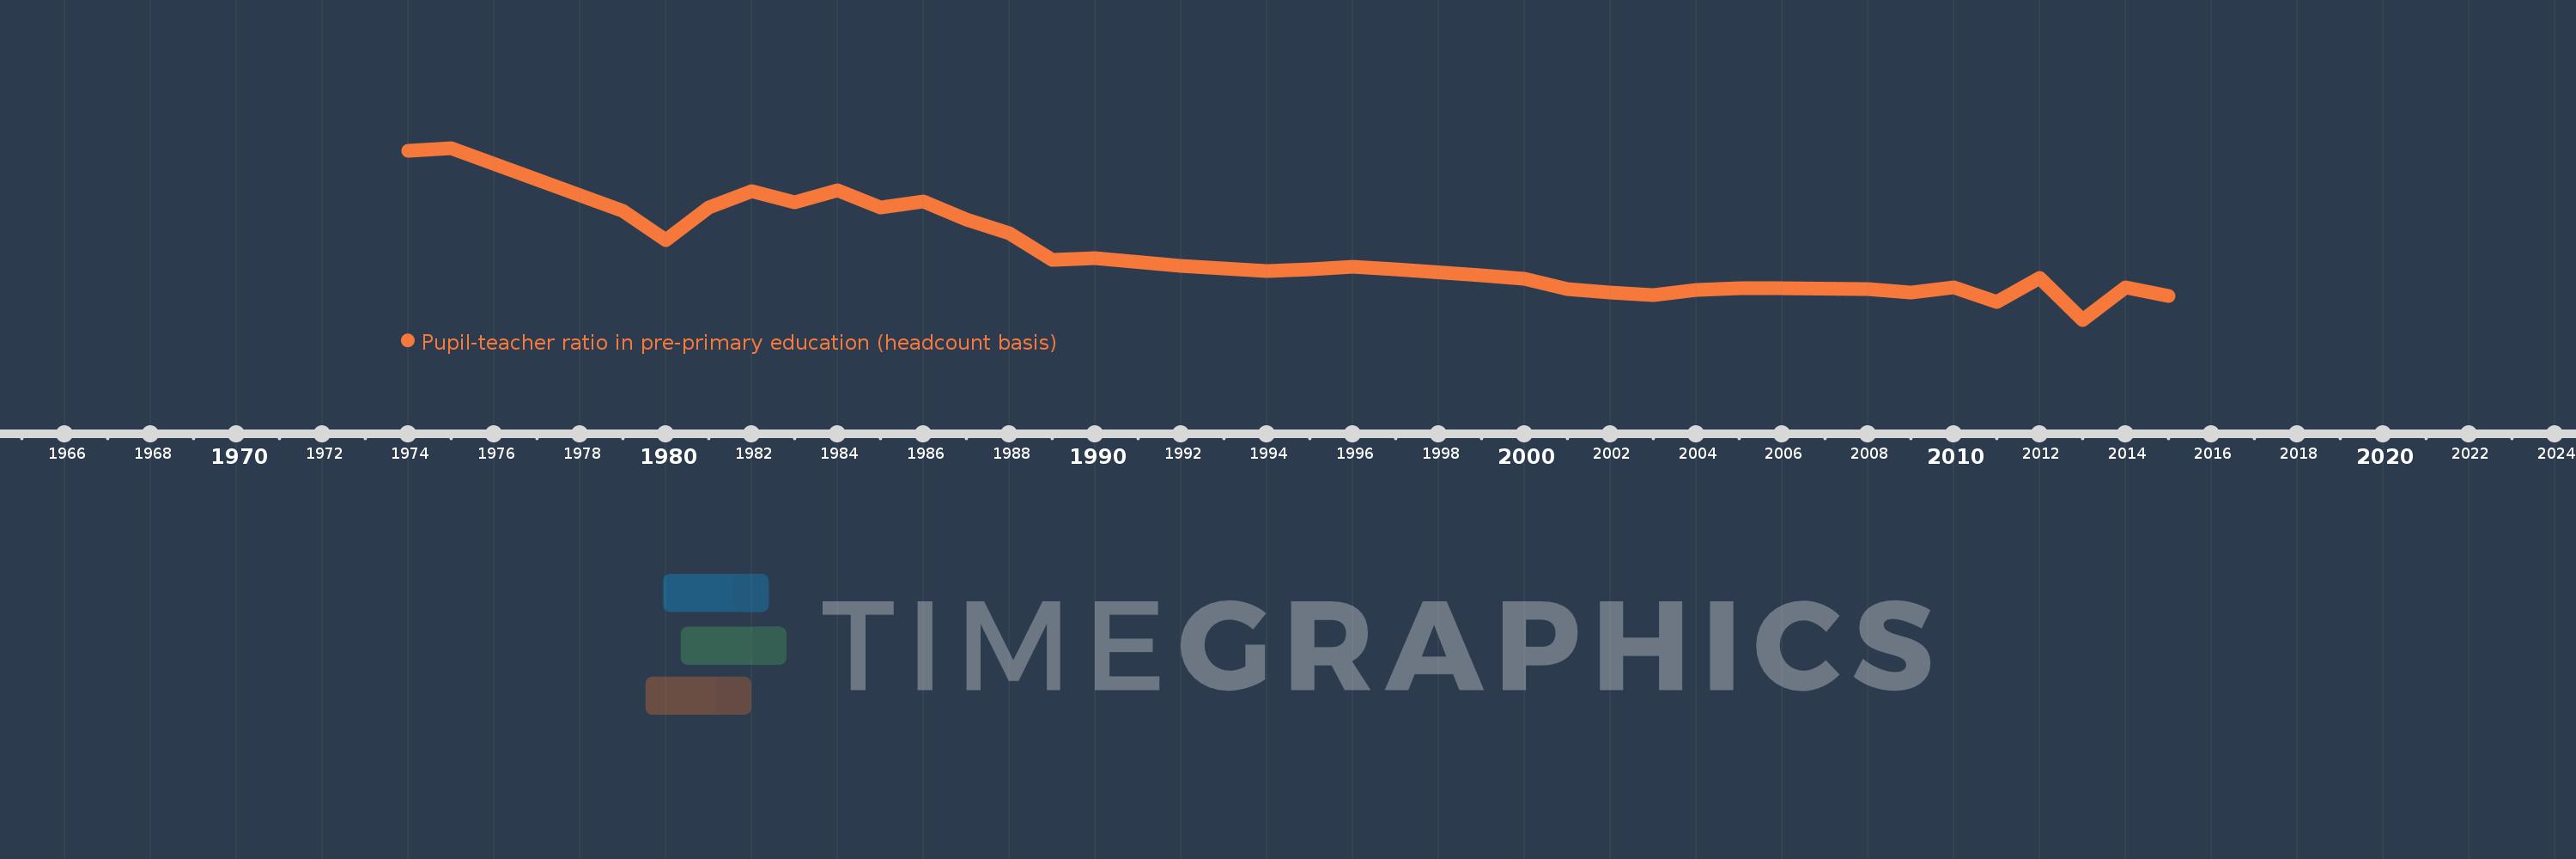
Pupil-teacher ratio in pre-primary education (headcount basis)
2015,2014,2013,2012,2011,2010,2009,2008,2006,2005,2004,2003,2002,2001,2000,1999,1997,1996,1995,1994,1993,1992,1990,1989,1988,1987,1986,1985,1984,1983,1982,1981,1980,1979,1975,1974
Estas estatísticas em outros países:
AfghanistanAlbaniaAlgeriaAndorraAngolaAntigua and BarbudaArab WorldArgentinaArmeniaArubaAustriaAzerbaijanBahamas, TheBahrainBangladeshBarbadosBelarusBelgiumBelizeBeninBermudaBhutanBoliviaBosnia and HerzegovinaBotswanaBrazilBritish Virgin IslandsBrunei DarussalamBulgariaBurkina FasoBurundiCabo VerdeCambodiaCameroonCanadaCaribbean small statesCayman IslandsCentral African RepublicCentral Europe and the BalticsChadChileChinaColombiaComorosCongo, Dem. Rep.Congo, Rep.Costa RicaCote d'IvoireCroatiaCubaCyprusCzech RepublicDenmarkDjiboutiDominicaDominican RepublicEarly-demographic dividendEast Asia & PacificEast Asia & Pacific (excluding high income)East Asia & Pacific (IDA & IBRD countries)EcuadorEgypt, Arab Rep.El SalvadorEquatorial GuineaEritreaEstoniaEthiopiaEuro areaEurope & Central AsiaEurope & Central Asia (excluding high income)Europe & Central Asia (IDA & IBRD countries)European UnionFijiFinlandFragile and conflict affected situationsFranceGabonGambia, TheGeorgiaGermanyGhanaGibraltarGreeceGrenadaGuatemalaGuineaGuinea-BissauGuyanaHaitiHeavily indebted poor countries (HIPC)High incomeHondurasHong Kong SAR, ChinaHungaryIBRD onlyIcelandIDA & IBRD totalIDA blendIDA onlyIDA totalIndiaIndonesiaIran, Islamic Rep.IraqIrelandIsraelItalyJamaicaJapanJordanKazakhstanKenyaKorea, Dem. People’s Rep.Korea, Rep.KuwaitKyrgyz RepublicLao PDRLate-demographic dividendLatin America & Caribbean Latin America & Caribbean (excluding high income)Latin America & the Caribbean (IDA & IBRD countries)LatviaLeast developed countries: UN classificationLebanonLesothoLiberiaLibyaLiechtensteinLithuaniaLow & middle incomeLow incomeLower middle incomeLuxembourgMacao SAR, ChinaMacedonia, FYRMadagascarMalaysiaMaldivesMaliMaltaMarshall IslandsMauritaniaMauritiusMexicoMiddle East & North AfricaMiddle East & North Africa (excluding high income)Middle East & North Africa (IDA & IBRD countries)Middle incomeMoldovaMonacoMongoliaMontenegroMoroccoMozambiqueMyanmarNamibiaNauruNepalNetherlandsNew ZealandNicaraguaNigerNigeriaNorth AmericaNorwayOECD membersOmanOther small statesPacific island small statesPalauPanamaPapua New GuineaParaguayPeruPhilippinesPolandPortugalPost-demographic dividendPre-demographic dividendPuerto RicoQatarRomaniaRussian FederationRwandaSamoaSan MarinoSao Tome and PrincipeSaudi ArabiaSenegalSerbiaSeychellesSierra LeoneSingaporeSlovak RepublicSloveniaSmall statesSolomon IslandsSomaliaSouth AfricaSouth AsiaSouth Asia (IDA & IBRD)South SudanSpainSt. Kitts and NevisSt. LuciaSt. Vincent and the GrenadinesSub-Saharan Africa Sub-Saharan Africa (excluding high income)Sub-Saharan Africa (IDA & IBRD countries)SudanSurinameSwazilandSwedenSwitzerlandSyrian Arab RepublicTajikistanTanzaniaThailandTimor-LesteTogoTongaTrinidad and TobagoTunisiaTurkeyTurks and Caicos IslandsTuvaluUgandaUkraineUnited Arab EmiratesUnited KingdomUnited StatesUpper middle incomeUruguayUzbekistanVanuatuVenezuela, RBVietnamWest Bank and GazaWorldYemen, Rep.Zimbabwe Linha do tempo:
Nesta escala de tempo está apresentado um gráfico de 1974 ano até 2015 ano Seychelles. Dados de 1973 ano ausente. O número de observações reais por data: 36.
Fonte (nome):
Indicadores de desenvolvimento mundial
Fonte (organização):
UNESCO Institute for Statistics
Categorias:
Education
Foi atualizado:
23 abr 2017 ano
Indicadores de alterações dos valores ao longo dos anos
Mínimo:
9.775
1 jan 2013 ano
Máximo:
38.049
1 jan 1975 ano
Na data de observação
Valor
Mudança absoluta
A alteração em relação ao valor anterior
1 jan 1974 ano
37.61
+37.61
0.0%
1 jan 1975 ano
38.049
+0.439
1.17%
1 jan 1979 ano
27.662
-10.386
-27.3%
1 jan 1980 ano
22.848
-4.814
-17.4%
1 jan 1981 ano
28.22
+5.372
23.51%
1 jan 1982 ano
30.944
+2.725
9.66%
1 jan 1983 ano
29.14
-1.804
-5.83%
1 jan 1984 ano
31.032
+1.891
6.49%
1 jan 1985 ano
28.273
-2.759
-8.89%
1 jan 1986 ano
29.174
+0.902
3.19%
1 jan 1987 ano
26.22
-2.954
-10.12%
1 jan 1988 ano
24.007
-2.213
-8.44%
1 jan 1989 ano
19.655
-4.353
-18.13%
1 jan 1990 ano
19.977
+0.322
1.64%
1 jan 1992 ano
18.611
-1.365
-6.84%
1 jan 1993 ano
18.176
-0.435
-2.34%
1 jan 1994 ano
17.857
-0.319
-1.76%
1 jan 1995 ano
18.097
+0.24
1.34%
1 jan 1996 ano
18.466
+0.369
2.04%
1 jan 1997 ano
18.122
-0.344
-1.86%
1 jan 1999 ano
17.031
-1.091
-6.02%
1 jan 2000 ano
16.472
-0.559
-3.28%
1 jan 2001 ano
14.879
-1.593
-9.67%
1 jan 2002 ano
14.231
-0.648
-4.35%
1 jan 2003 ano
13.886
-0.345
-2.42%
1 jan 2004 ano
14.713
+0.827
5.95%
1 jan 2005 ano
15.016
+0.303
2.06%
1 jan 2006 ano
15.016
0.0
0.0%
1 jan 2008 ano
14.843
-0.173
-1.15%
1 jan 2009 ano
14.189
-0.654
-4.4%
1 jan 2010 ano
15.171
+0.982
6.92%
1 jan 2011 ano
12.651
-2.52
-16.61%
1 jan 2012 ano
16.663
+4.012
31.71%
1 jan 2013 ano
9.775
-6.888
-41.34%
1 jan 2014 ano
15.077
+5.302
54.24%
1 jan 2015 ano
13.649
-1.428
-9.47%
Classificação de países por estatísticas atuais por anos


Comentários: