29
/pt/
pt
AIzaSyAYiBZKx7MnpbEhh9jyipgxe19OcubqV5w
April 1, 2024
33006
Europe & Central Asia (IDA & IBRD countries)
TEC
false
2
1
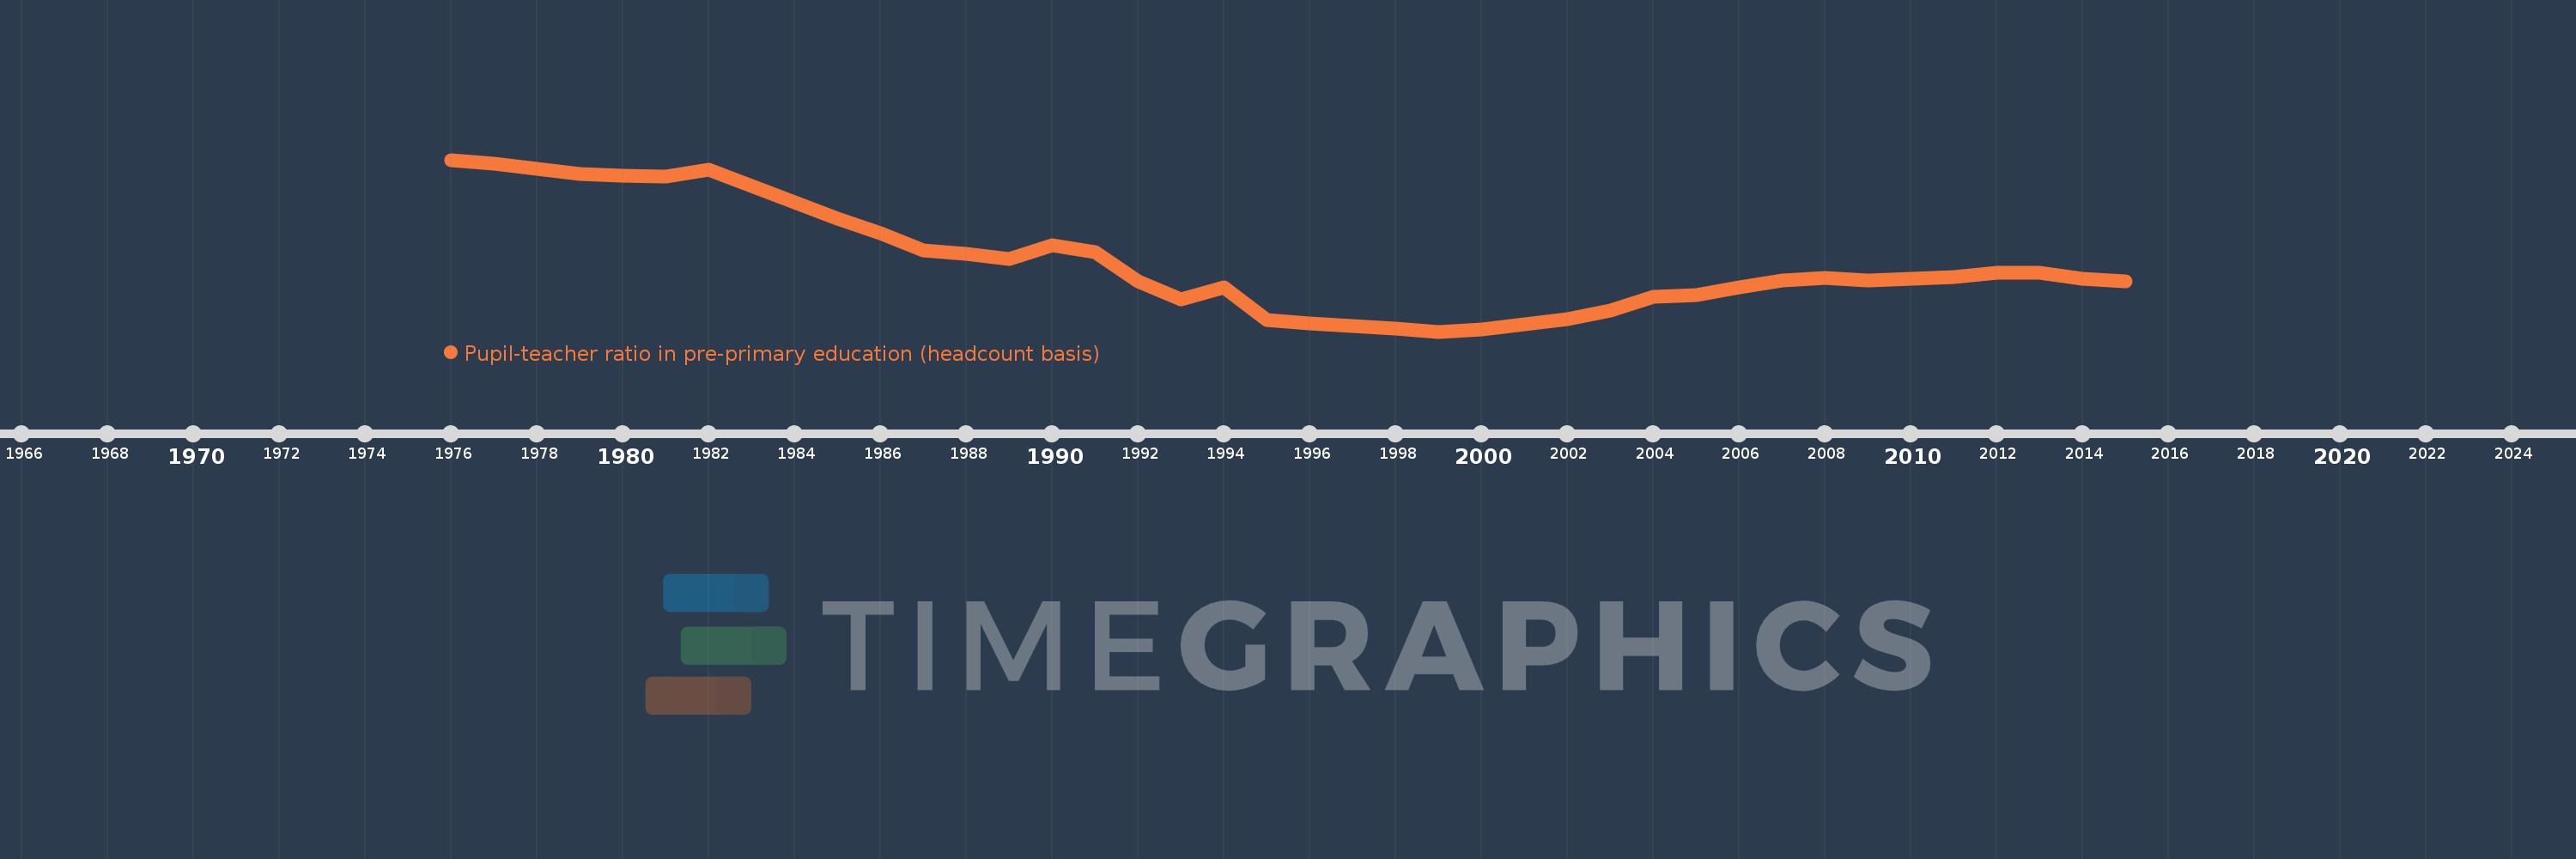
Pupil-teacher ratio in pre-primary education (headcount basis)
2015,2014,2013,2012,2011,2010,2009,2008,2007,2006,2005,2004,2003,2002,2001,2000,1999,1998,1997,1996,1995,1994,1993,1992,1991,1990,1989,1988,1987,1986,1985,1984,1983,1982,1981,1980,1979,1978,1977,1976
Estas estatísticas em outros países:
AfghanistanAlbaniaAlgeriaAndorraAngolaAntigua and BarbudaArab WorldArgentinaArmeniaArubaAustriaAzerbaijanBahamas, TheBahrainBangladeshBarbadosBelarusBelgiumBelizeBeninBermudaBhutanBoliviaBosnia and HerzegovinaBotswanaBrazilBritish Virgin IslandsBrunei DarussalamBulgariaBurkina FasoBurundiCabo VerdeCambodiaCameroonCanadaCaribbean small statesCayman IslandsCentral African RepublicCentral Europe and the BalticsChadChileChinaColombiaComorosCongo, Dem. Rep.Congo, Rep.Costa RicaCote d'IvoireCroatiaCubaCyprusCzech RepublicDenmarkDjiboutiDominicaDominican RepublicEarly-demographic dividendEast Asia & PacificEast Asia & Pacific (excluding high income)East Asia & Pacific (IDA & IBRD countries)EcuadorEgypt, Arab Rep.El SalvadorEquatorial GuineaEritreaEstoniaEthiopiaEuro areaEurope & Central AsiaEurope & Central Asia (excluding high income)Europe & Central Asia (IDA & IBRD countries)European UnionFijiFinlandFragile and conflict affected situationsFranceGabonGambia, TheGeorgiaGermanyGhanaGibraltarGreeceGrenadaGuatemalaGuineaGuinea-BissauGuyanaHaitiHeavily indebted poor countries (HIPC)High incomeHondurasHong Kong SAR, ChinaHungaryIBRD onlyIcelandIDA & IBRD totalIDA blendIDA onlyIDA totalIndiaIndonesiaIran, Islamic Rep.IraqIrelandIsraelItalyJamaicaJapanJordanKazakhstanKenyaKorea, Dem. People’s Rep.Korea, Rep.KuwaitKyrgyz RepublicLao PDRLate-demographic dividendLatin America & Caribbean Latin America & Caribbean (excluding high income)Latin America & the Caribbean (IDA & IBRD countries)LatviaLeast developed countries: UN classificationLebanonLesothoLiberiaLibyaLiechtensteinLithuaniaLow & middle incomeLow incomeLower middle incomeLuxembourgMacao SAR, ChinaMacedonia, FYRMadagascarMalaysiaMaldivesMaliMaltaMarshall IslandsMauritaniaMauritiusMexicoMiddle East & North AfricaMiddle East & North Africa (excluding high income)Middle East & North Africa (IDA & IBRD countries)Middle incomeMoldovaMonacoMongoliaMontenegroMoroccoMozambiqueMyanmarNamibiaNauruNepalNetherlandsNew ZealandNicaraguaNigerNigeriaNorth AmericaNorwayOECD membersOmanOther small statesPacific island small statesPalauPanamaPapua New GuineaParaguayPeruPhilippinesPolandPortugalPost-demographic dividendPre-demographic dividendPuerto RicoQatarRomaniaRussian FederationRwandaSamoaSan MarinoSao Tome and PrincipeSaudi ArabiaSenegalSerbiaSeychellesSierra LeoneSingaporeSlovak RepublicSloveniaSmall statesSolomon IslandsSomaliaSouth AfricaSouth AsiaSouth Asia (IDA & IBRD)South SudanSpainSt. Kitts and NevisSt. LuciaSt. Vincent and the GrenadinesSub-Saharan Africa Sub-Saharan Africa (excluding high income)Sub-Saharan Africa (IDA & IBRD countries)SudanSurinameSwazilandSwedenSwitzerlandSyrian Arab RepublicTajikistanTanzaniaThailandTimor-LesteTogoTongaTrinidad and TobagoTunisiaTurkeyTurks and Caicos IslandsTuvaluUgandaUkraineUnited Arab EmiratesUnited KingdomUnited StatesUpper middle incomeUruguayUzbekistanVanuatuVenezuela, RBVietnamWest Bank and GazaWorldYemen, Rep.Zimbabwe Linha do tempo:
Nesta escala de tempo está apresentado um gráfico de 1976 ano até 2015 ano Europe & Central Asia (IDA & IBRD countries). Dados de 1975 ano ausente. O número de observações reais por data: 40.
Fonte (nome):
Indicadores de desenvolvimento mundial
Fonte (organização):
UNESCO Institute for Statistics
Categorias:
Education
Foi atualizado:
23 abr 2017 ano
Indicadores de alterações dos valores ao longo dos anos
Mínimo:
9.548
1 jan 1999 ano
Máximo:
12.497
1 jan 1976 ano
Na data de observação
Valor
Mudança absoluta
A alteração em relação ao valor anterior
1 jan 1976 ano
12.497
+12.497
0.0%
1 jan 1977 ano
12.424
-0.073
-0.58%
1 jan 1978 ano
12.336
-0.088
-0.71%
1 jan 1979 ano
12.248
-0.088
-0.72%
1 jan 1980 ano
12.224
-0.024
-0.2%
1 jan 1981 ano
12.203
-0.021
-0.17%
1 jan 1982 ano
12.333
+0.13
1.07%
1 jan 1983 ano
12.041
-0.292
-2.36%
1 jan 1984 ano
11.766
-0.275
-2.29%
1 jan 1985 ano
11.488
-0.278
-2.37%
1 jan 1986 ano
11.239
-0.249
-2.17%
1 jan 1987 ano
10.942
-0.296
-2.64%
1 jan 1988 ano
10.88
-0.062
-0.57%
1 jan 1989 ano
10.801
-0.08
-0.73%
1 jan 1990 ano
11.023
+0.222
2.06%
1 jan 1991 ano
10.907
-0.116
-1.05%
1 jan 1992 ano
10.414
-0.493
-4.52%
1 jan 1993 ano
10.106
-0.308
-2.96%
1 jan 1994 ano
10.306
+0.2
1.98%
1 jan 1995 ano
9.742
-0.564
-5.47%
1 jan 1996 ano
9.692
-0.05
-0.51%
1 jan 1997 ano
9.644
-0.047
-0.49%
1 jan 1998 ano
9.594
-0.051
-0.53%
1 jan 1999 ano
9.548
-0.046
-0.48%
1 jan 2000 ano
9.592
+0.045
0.47%
1 jan 2001 ano
9.668
+0.076
0.79%
1 jan 2002 ano
9.764
+0.096
1.0%
1 jan 2003 ano
9.904
+0.139
1.43%
1 jan 2004 ano
10.145
+0.241
2.43%
1 jan 2005 ano
10.18
+0.035
0.35%
1 jan 2006 ano
10.303
+0.123
1.21%
1 jan 2007 ano
10.423
+0.12
1.17%
1 jan 2008 ano
10.465
+0.043
0.41%
1 jan 2009 ano
10.425
-0.04
-0.38%
1 jan 2010 ano
10.454
+0.029
0.28%
1 jan 2011 ano
10.485
+0.031
0.29%
1 jan 2012 ano
10.556
+0.071
0.68%
1 jan 2013 ano
10.555
-0.001
-0.01%
1 jan 2014 ano
10.458
-0.097
-0.92%
1 jan 2015 ano
10.407
-0.051
-0.49%
Classificação de países por estatísticas atuais por anos


Comentários: