29
/pt/
pt
AIzaSyAYiBZKx7MnpbEhh9jyipgxe19OcubqV5w
April 1, 2024
116192
Cuba
CUB
true
2
1
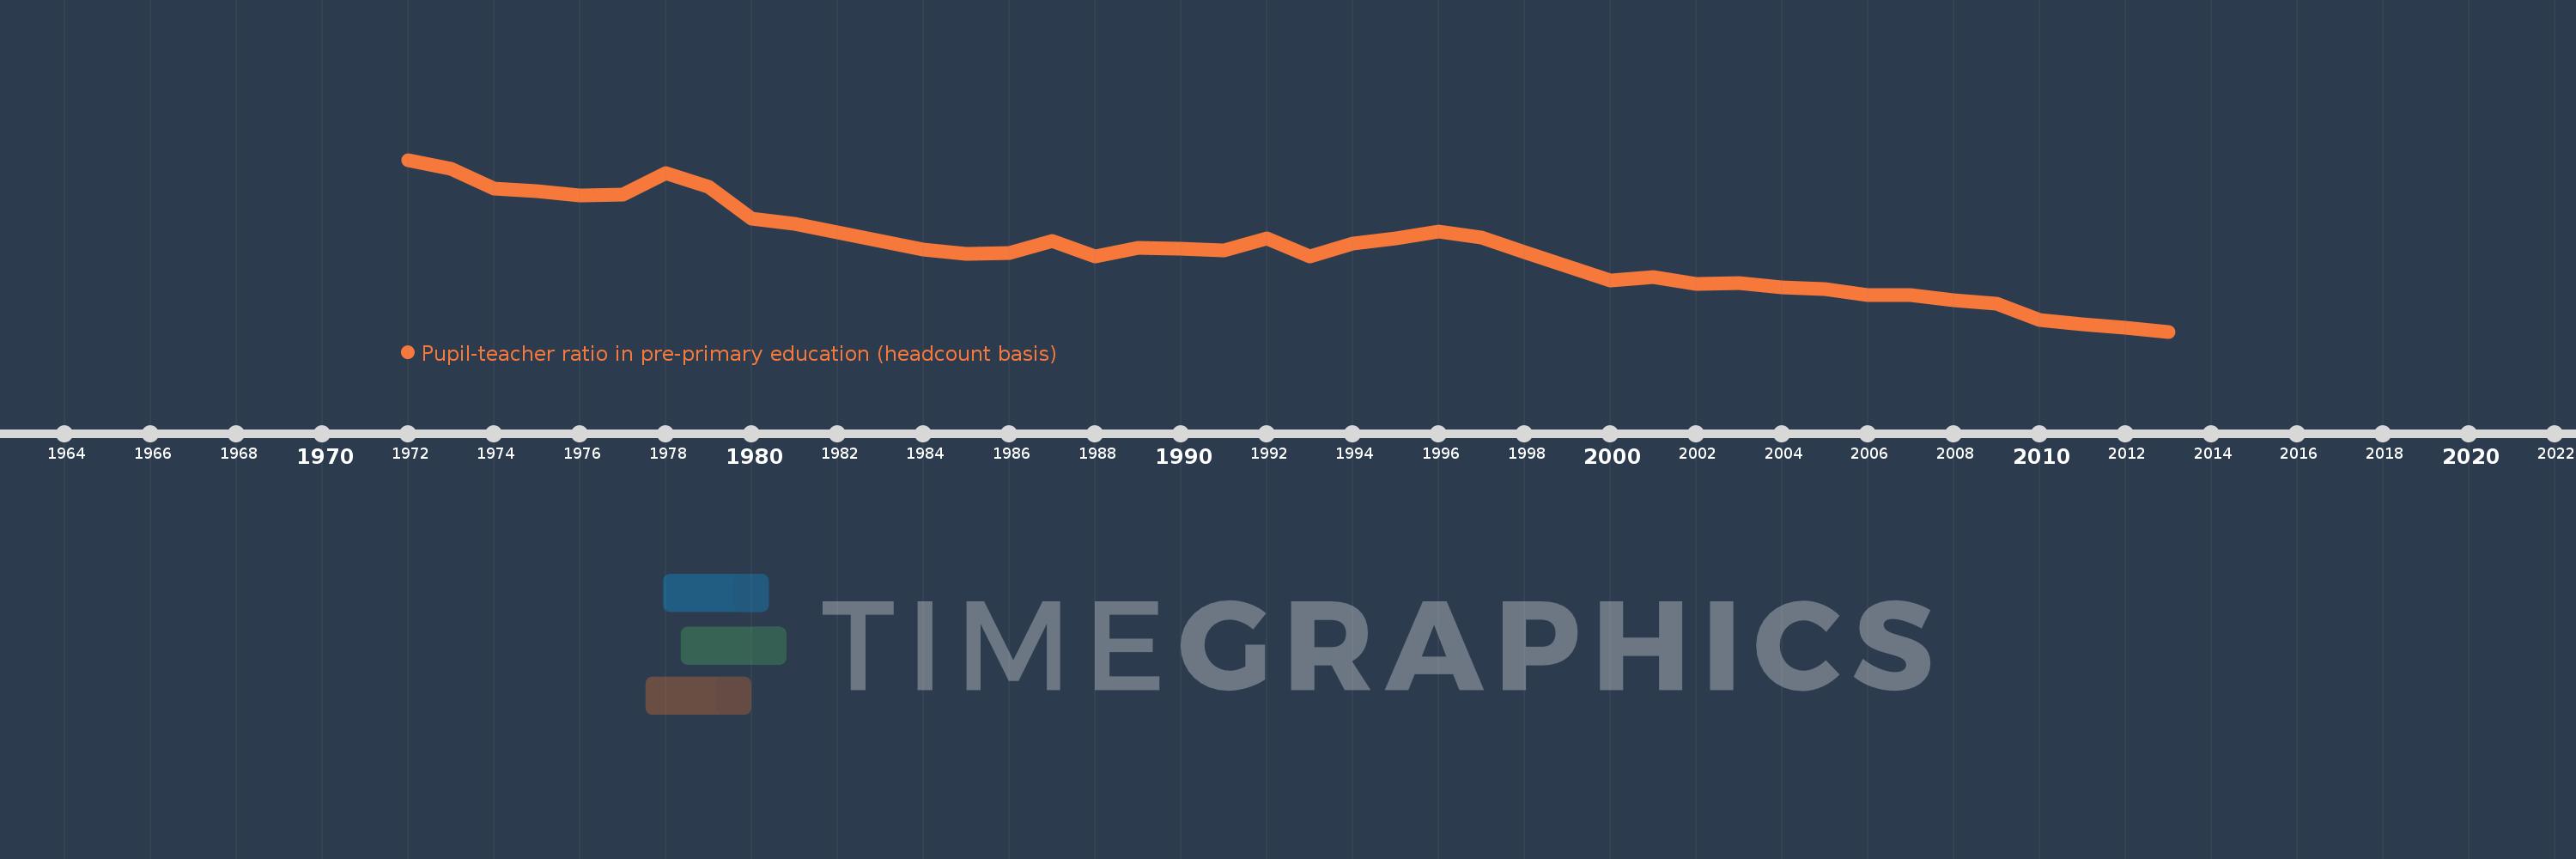
Pupil-teacher ratio in pre-primary education (headcount basis)
2013,2012,2011,2010,2009,2008,2007,2006,2005,2004,2003,2002,2001,2000,1998,1997,1996,1995,1994,1993,1992,1991,1990,1989,1988,1987,1986,1985,1984,1983,1982,1981,1980,1979,1978,1977,1976,1975,1974,1973,1972
Estas estatísticas em outros países:
AfghanistanAlbaniaAlgeriaAndorraAngolaAntigua and BarbudaArab WorldArgentinaArmeniaArubaAustriaAzerbaijanBahamas, TheBahrainBangladeshBarbadosBelarusBelgiumBelizeBeninBermudaBhutanBoliviaBosnia and HerzegovinaBotswanaBrazilBritish Virgin IslandsBrunei DarussalamBulgariaBurkina FasoBurundiCabo VerdeCambodiaCameroonCanadaCaribbean small statesCayman IslandsCentral African RepublicCentral Europe and the BalticsChadChileChinaColombiaComorosCongo, Dem. Rep.Congo, Rep.Costa RicaCote d'IvoireCroatiaCubaCyprusCzech RepublicDenmarkDjiboutiDominicaDominican RepublicEarly-demographic dividendEast Asia & PacificEast Asia & Pacific (excluding high income)East Asia & Pacific (IDA & IBRD countries)EcuadorEgypt, Arab Rep.El SalvadorEquatorial GuineaEritreaEstoniaEthiopiaEuro areaEurope & Central AsiaEurope & Central Asia (excluding high income)Europe & Central Asia (IDA & IBRD countries)European UnionFijiFinlandFragile and conflict affected situationsFranceGabonGambia, TheGeorgiaGermanyGhanaGibraltarGreeceGrenadaGuatemalaGuineaGuinea-BissauGuyanaHaitiHeavily indebted poor countries (HIPC)High incomeHondurasHong Kong SAR, ChinaHungaryIBRD onlyIcelandIDA & IBRD totalIDA blendIDA onlyIDA totalIndiaIndonesiaIran, Islamic Rep.IraqIrelandIsraelItalyJamaicaJapanJordanKazakhstanKenyaKorea, Dem. People’s Rep.Korea, Rep.KuwaitKyrgyz RepublicLao PDRLate-demographic dividendLatin America & Caribbean Latin America & Caribbean (excluding high income)Latin America & the Caribbean (IDA & IBRD countries)LatviaLeast developed countries: UN classificationLebanonLesothoLiberiaLibyaLiechtensteinLithuaniaLow & middle incomeLow incomeLower middle incomeLuxembourgMacao SAR, ChinaMacedonia, FYRMadagascarMalaysiaMaldivesMaliMaltaMarshall IslandsMauritaniaMauritiusMexicoMiddle East & North AfricaMiddle East & North Africa (excluding high income)Middle East & North Africa (IDA & IBRD countries)Middle incomeMoldovaMonacoMongoliaMontenegroMoroccoMozambiqueMyanmarNamibiaNauruNepalNetherlandsNew ZealandNicaraguaNigerNigeriaNorth AmericaNorwayOECD membersOmanOther small statesPacific island small statesPalauPanamaPapua New GuineaParaguayPeruPhilippinesPolandPortugalPost-demographic dividendPre-demographic dividendPuerto RicoQatarRomaniaRussian FederationRwandaSamoaSan MarinoSao Tome and PrincipeSaudi ArabiaSenegalSerbiaSeychellesSierra LeoneSingaporeSlovak RepublicSloveniaSmall statesSolomon IslandsSomaliaSouth AfricaSouth AsiaSouth Asia (IDA & IBRD)South SudanSpainSt. Kitts and NevisSt. LuciaSt. Vincent and the GrenadinesSub-Saharan Africa Sub-Saharan Africa (excluding high income)Sub-Saharan Africa (IDA & IBRD countries)SudanSurinameSwazilandSwedenSwitzerlandSyrian Arab RepublicTajikistanTanzaniaThailandTimor-LesteTogoTongaTrinidad and TobagoTunisiaTurkeyTurks and Caicos IslandsTuvaluUgandaUkraineUnited Arab EmiratesUnited KingdomUnited StatesUpper middle incomeUruguayUzbekistanVanuatuVenezuela, RBVietnamWest Bank and GazaWorldYemen, Rep.Zimbabwe Linha do tempo:
Nesta escala de tempo está apresentado um gráfico de 1972 ano até 2013 ano Cuba. Dados de 1971 ano ausente. O número de observações reais por data: 41.
Fonte (nome):
Indicadores de desenvolvimento mundial
Fonte (organização):
UNESCO Institute for Statistics
Categorias:
Education
Foi atualizado:
23 abr 2017 ano
Indicadores de alterações dos valores ao longo dos anos
Mínimo:
12.674
1 jan 2013 ano
Máximo:
33.257
1 jan 1972 ano
Na data de observação
Valor
Mudança absoluta
A alteração em relação ao valor anterior
1 jan 1972 ano
33.257
+33.257
0.0%
1 jan 1973 ano
32.164
-1.093
-3.29%
1 jan 1974 ano
29.765
-2.399
-7.46%
1 jan 1975 ano
29.512
-0.253
-0.85%
1 jan 1976 ano
28.975
-0.537
-1.82%
1 jan 1977 ano
29.042
+0.067
0.23%
1 jan 1978 ano
31.685
+2.643
9.1%
1 jan 1979 ano
30.023
-1.662
-5.25%
1 jan 1980 ano
26.22
-3.803
-12.67%
1 jan 1981 ano
25.56
-0.66
-2.52%
1 jan 1982 ano
24.518
-1.042
-4.08%
1 jan 1983 ano
23.495
-1.023
-4.17%
1 jan 1984 ano
22.456
-1.039
-4.42%
1 jan 1985 ano
21.98
-0.475
-2.12%
1 jan 1986 ano
22.117
+0.137
0.62%
1 jan 1987 ano
23.491
+1.374
6.21%
1 jan 1988 ano
21.658
-1.833
-7.8%
1 jan 1989 ano
22.717
+1.059
4.89%
1 jan 1990 ano
22.649
-0.068
-0.3%
1 jan 1991 ano
22.352
-0.296
-1.31%
1 jan 1992 ano
23.831
+1.478
6.61%
1 jan 1993 ano
21.657
-2.173
-9.12%
1 jan 1994 ano
23.206
+1.549
7.15%
1 jan 1995 ano
23.839
+0.633
2.73%
1 jan 1996 ano
24.613
+0.774
3.25%
1 jan 1997 ano
23.899
-0.715
-2.9%
1 jan 1998 ano
22.169
-1.729
-7.24%
1 jan 2000 ano
18.832
-3.337
-15.05%
1 jan 2001 ano
19.255
+0.422
2.24%
1 jan 2002 ano
18.383
-0.872
-4.53%
1 jan 2003 ano
18.443
+0.06
0.33%
1 jan 2004 ano
17.925
-0.518
-2.81%
1 jan 2005 ano
17.762
-0.162
-0.91%
1 jan 2006 ano
17.049
-0.714
-4.02%
1 jan 2007 ano
17.061
+0.012
0.07%
1 jan 2008 ano
16.447
-0.614
-3.6%
1 jan 2009 ano
15.984
-0.463
-2.81%
1 jan 2010 ano
14.047
-1.938
-12.12%
1 jan 2011 ano
13.599
-0.448
-3.19%
1 jan 2012 ano
13.089
-0.51
-3.75%
1 jan 2013 ano
12.674
-0.414
-3.17%
Classificação de países por estatísticas atuais por anos


Comentários: