29
/pt/
pt
AIzaSyAYiBZKx7MnpbEhh9jyipgxe19OcubqV5w
April 1, 2024
65218
Albania
ALB
true
2
1
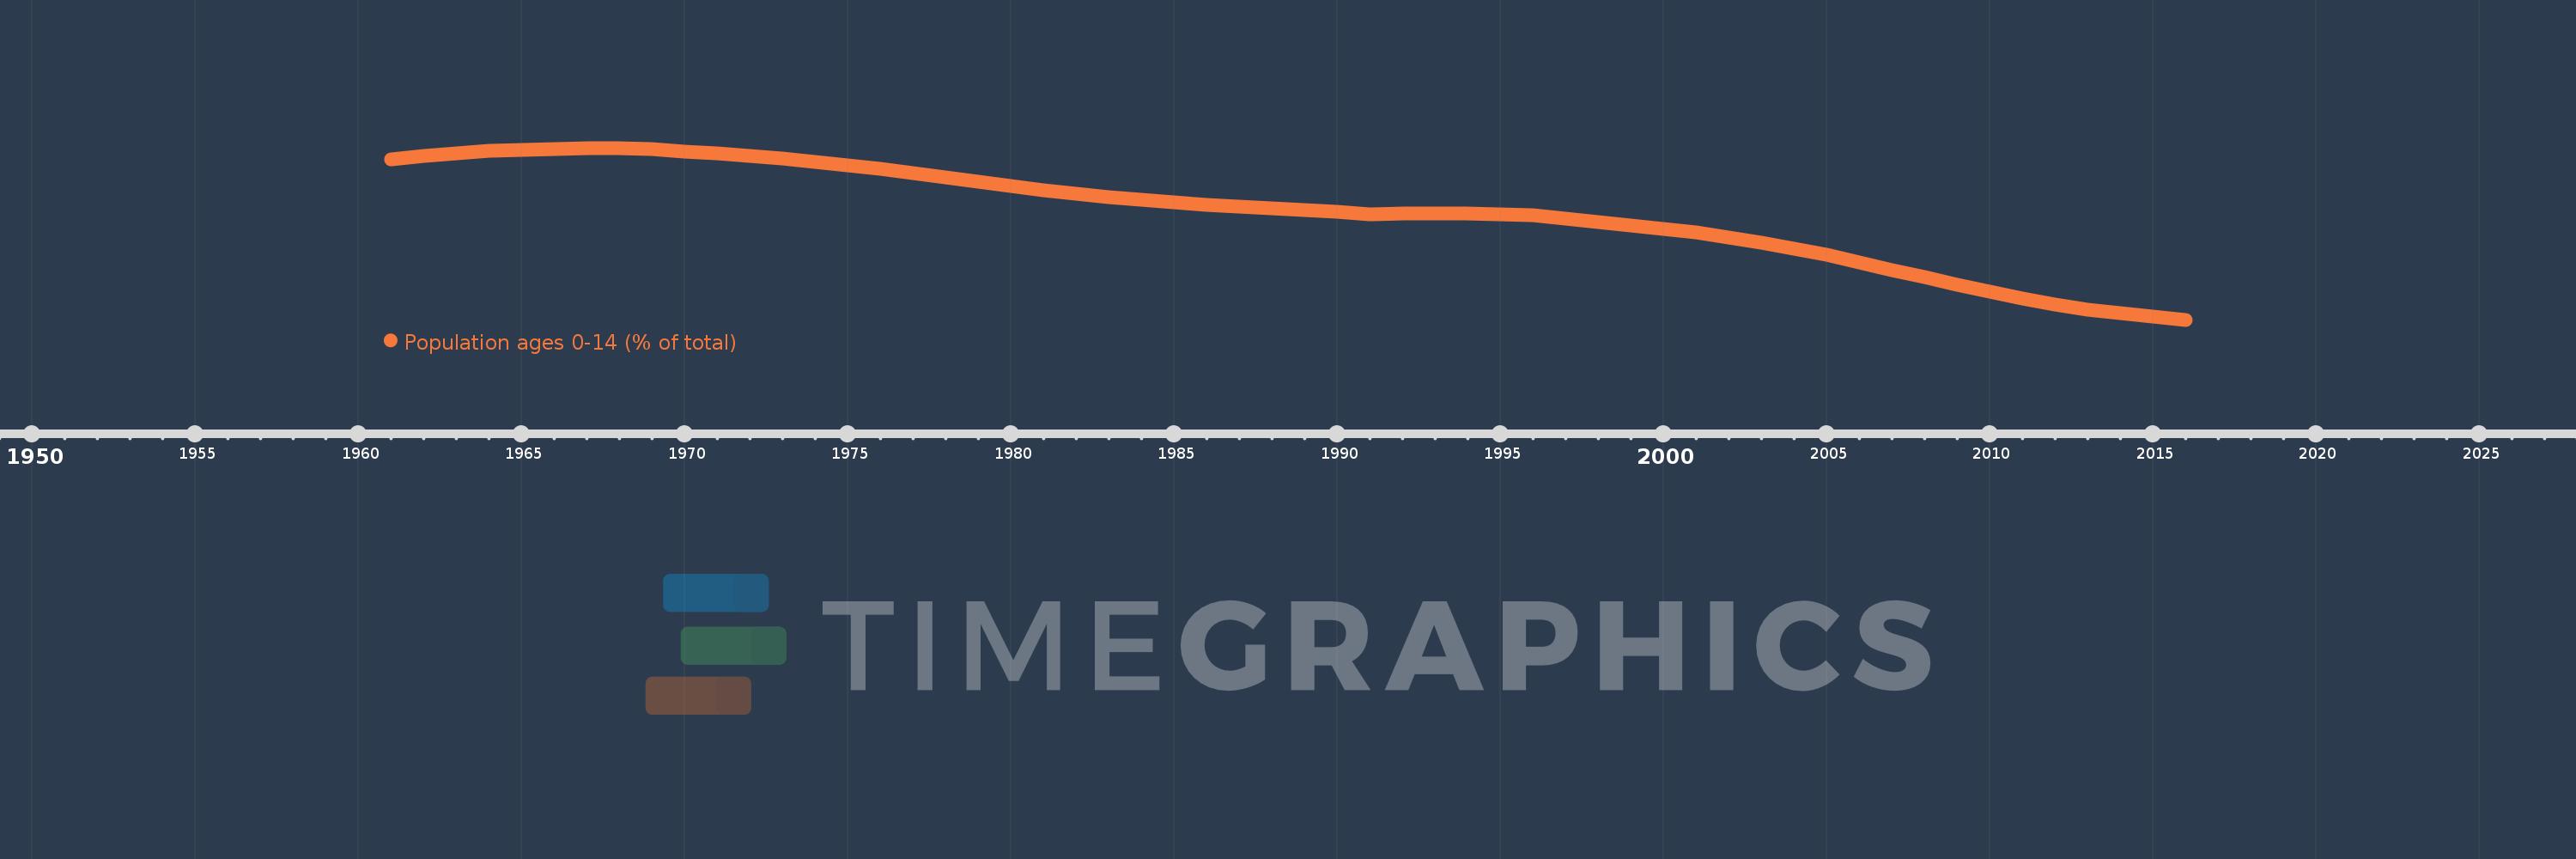
Population ages 0-14 (% of total)
2016,2015,2014,2013,2012,2011,2010,2009,2008,2007,2006,2005,2004,2003,2002,2001,2000,1999,1998,1997,1996,1995,1994,1993,1992,1991,1990,1989,1988,1987,1986,1985,1984,1983,1982,1981,1980,1979,1978,1977,1976,1975,1974,1973,1972,1971,1970,1969,1968,1967,1966,1965,1964,1963,1962,1961
Estas estatísticas em outros países:
AfghanistanAlbaniaAlgeriaAngolaAntigua and BarbudaArab WorldArgentinaArmeniaArubaAustraliaAustriaAzerbaijanBahamas, TheBahrainBangladeshBarbadosBelarusBelgiumBelizeBeninBhutanBoliviaBosnia and HerzegovinaBotswanaBrazilBrunei DarussalamBulgariaBurkina FasoBurundiCabo VerdeCambodiaCameroonCanadaCaribbean small statesCentral African RepublicCentral Europe and the BalticsChadChannel IslandsChileChinaColombiaComorosCongo, Dem. Rep.Congo, Rep.Costa RicaCote d'IvoireCroatiaCubaCuracaoCyprusCzech RepublicDenmarkDjiboutiDominican RepublicEarly-demographic dividendEast Asia & PacificEast Asia & Pacific (excluding high income)East Asia & Pacific (IDA & IBRD countries)EcuadorEgypt, Arab Rep.El SalvadorEquatorial GuineaEritreaEstoniaEthiopiaEuro areaEurope & Central AsiaEurope & Central Asia (excluding high income)Europe & Central Asia (IDA & IBRD countries)European UnionFijiFinlandFragile and conflict affected situationsFranceFrench PolynesiaGabonGambia, TheGeorgiaGermanyGhanaGreeceGrenadaGuamGuatemalaGuineaGuinea-BissauGuyanaHaitiHeavily indebted poor countries (HIPC)High incomeHondurasHong Kong SAR, ChinaHungaryIBRD onlyIcelandIDA & IBRD totalIDA blendIDA onlyIDA totalIndiaIndonesiaIran, Islamic Rep.IraqIrelandIsraelItalyJamaicaJapanJordanKazakhstanKenyaKiribatiKorea, Dem. People’s Rep.Korea, Rep.KosovoKuwaitKyrgyz RepublicLao PDRLate-demographic dividendLatin America & Caribbean Latin America & Caribbean (excluding high income)Latin America & the Caribbean (IDA & IBRD countries)LatviaLeast developed countries: UN classificationLebanonLesothoLiberiaLibyaLithuaniaLow & middle incomeLow incomeLower middle incomeLuxembourgMacao SAR, ChinaMacedonia, FYRMadagascarMalawiMalaysiaMaldivesMaliMaltaMauritaniaMauritiusMexicoMicronesia, Fed. Sts.Middle East & North AfricaMiddle East & North Africa (excluding high income)Middle East & North Africa (IDA & IBRD countries)Middle incomeMoldovaMongoliaMontenegroMoroccoMozambiqueMyanmarNamibiaNepalNetherlandsNew CaledoniaNew ZealandNicaraguaNigerNigeriaNorth AmericaNorwayOECD membersOmanOther small statesPacific island small statesPakistanPanamaPapua New GuineaParaguayPeruPhilippinesPolandPortugalPost-demographic dividendPre-demographic dividendPuerto RicoQatarRomaniaRussian FederationRwandaSamoaSao Tome and PrincipeSaudi ArabiaSenegalSerbiaSeychellesSierra LeoneSingaporeSlovak RepublicSloveniaSmall statesSolomon IslandsSomaliaSouth AfricaSouth AsiaSouth Asia (IDA & IBRD)South SudanSpainSri LankaSt. LuciaSt. Vincent and the GrenadinesSub-Saharan Africa Sub-Saharan Africa (excluding high income)Sub-Saharan Africa (IDA & IBRD countries)SudanSurinameSwazilandSwedenSwitzerlandSyrian Arab RepublicTajikistanTanzaniaThailandTimor-LesteTogoTongaTrinidad and TobagoTunisiaTurkeyTurkmenistanUgandaUkraineUnited Arab EmiratesUnited KingdomUnited StatesUpper middle incomeUruguayUzbekistanVanuatuVenezuela, RBVietnamVirgin Islands (U.S.)West Bank and GazaWorldYemen, Rep.ZambiaZimbabwe Linha do tempo:
Nesta escala de tempo está apresentado um gráfico de 1961 ano até 2016 ano Albania. Dados de 1960 ano ausente. O número de observações reais por data: 56.
Fonte (nome):
Indicadores de desenvolvimento mundial
Fonte (organização):
World Bank staff estimates based on age distributions of United Nations Population Division's World Population Prospects.
Categorias:
Education, Health
Foi atualizado:
23 abr 2017 ano
Indicadores de alterações dos valores ao longo dos anos
Mínimo:
18.546
1 jan 2016 ano
Máximo:
41.642
1 jan 1967 ano
Na data de observação
Valor
Mudança absoluta
A alteração em relação ao valor anterior
1 jan 1961 ano
40.155
+40.155
0.0%
1 jan 1962 ano
40.541
+0.386
0.96%
1 jan 1963 ano
40.9
+0.359
0.89%
1 jan 1964 ano
41.212
+0.312
0.76%
1 jan 1965 ano
41.432
+0.221
0.54%
1 jan 1966 ano
41.532
+0.1
0.24%
1 jan 1967 ano
41.642
+0.11
0.27%
1 jan 1968 ano
41.6
-0.042
-0.1%
1 jan 1969 ano
41.437
-0.164
-0.39%
1 jan 1970 ano
41.198
-0.239
-0.58%
1 jan 1971 ano
40.91
-0.288
-0.7%
1 jan 1972 ano
40.541
-0.369
-0.9%
1 jan 1973 ano
40.179
-0.362
-0.89%
1 jan 1974 ano
39.79
-0.389
-0.97%
1 jan 1975 ano
39.329
-0.461
-1.16%
1 jan 1976 ano
38.785
-0.544
-1.38%
1 jan 1977 ano
38.296
-0.489
-1.26%
1 jan 1978 ano
37.71
-0.586
-1.53%
1 jan 1979 ano
37.08
-0.63
-1.67%
1 jan 1980 ano
36.481
-0.599
-1.62%
1 jan 1981 ano
35.949
-0.532
-1.46%
1 jan 1982 ano
35.462
-0.487
-1.35%
1 jan 1983 ano
35.037
-0.425
-1.2%
1 jan 1984 ano
34.66
-0.377
-1.08%
1 jan 1985 ano
34.311
-0.349
-1.01%
1 jan 1986 ano
33.987
-0.324
-0.94%
1 jan 1987 ano
33.71
-0.277
-0.82%
1 jan 1988 ano
33.477
-0.233
-0.69%
1 jan 1989 ano
33.265
-0.212
-0.63%
1 jan 1990 ano
33.022
-0.243
-0.73%
1 jan 1991 ano
32.696
-0.326
-0.99%
1 jan 1992 ano
32.812
+0.116
0.36%
1 jan 1993 ano
32.855
+0.042
0.13%
1 jan 1994 ano
32.813
-0.042
-0.13%
1 jan 1995 ano
32.73
-0.083
-0.25%
1 jan 1996 ano
32.655
-0.075
-0.23%
1 jan 1997 ano
32.128
-0.527
-1.61%
1 jan 1998 ano
31.664
-0.464
-1.44%
1 jan 1999 ano
31.237
-0.427
-1.35%
1 jan 2000 ano
30.787
-0.45
-1.44%
1 jan 2001 ano
30.263
-0.524
-1.7%
1 jan 2002 ano
29.637
-0.627
-2.07%
1 jan 2003 ano
28.923
-0.714
-2.41%
1 jan 2004 ano
28.115
-0.808
-2.79%
1 jan 2005 ano
27.232
-0.883
-3.14%
1 jan 2006 ano
26.291
-0.941
-3.46%
1 jan 2007 ano
25.254
-1.037
-3.94%
1 jan 2008 ano
24.233
-1.021
-4.04%
1 jan 2009 ano
23.223
-1.01
-4.17%
1 jan 2010 ano
22.268
-0.955
-4.11%
1 jan 2011 ano
21.425
-0.843
-3.79%
1 jan 2012 ano
20.609
-0.816
-3.81%
1 jan 2013 ano
19.928
-0.681
-3.3%
1 jan 2014 ano
19.382
-0.546
-2.74%
1 jan 2015 ano
18.93
-0.452
-2.33%
1 jan 2016 ano
18.546
-0.384
-2.03%
Classificação de países por estatísticas atuais por anos


Comentários: