29
/pt/
pt
AIzaSyAYiBZKx7MnpbEhh9jyipgxe19OcubqV5w
April 1, 2024
231526
Rwanda
RWA
true
2
1
Population ages 0-14 (% of total)
2016,2015,2014,2013,2012,2011,2010,2009,2008,2007,2006,2005,2004,2003,2002,2001,2000,1999,1998,1997,1996,1995,1994,1993,1992,1991,1990,1989,1988,1987,1986,1985,1984,1983,1982,1981,1980,1979,1978,1977,1976,1975,1974,1973,1972,1971,1970,1969,1968,1967,1966,1965,1964,1963,1962,1961
Estas estatísticas em outros países:
AfghanistanAlbaniaAlgeriaAngolaAntigua and BarbudaArab WorldArgentinaArmeniaArubaAustraliaAustriaAzerbaijanBahamas, TheBahrainBangladeshBarbadosBelarusBelgiumBelizeBeninBhutanBoliviaBosnia and HerzegovinaBotswanaBrazilBrunei DarussalamBulgariaBurkina FasoBurundiCabo VerdeCambodiaCameroonCanadaCaribbean small statesCentral African RepublicCentral Europe and the BalticsChadChannel IslandsChileChinaColombiaComorosCongo, Dem. Rep.Congo, Rep.Costa RicaCote d'IvoireCroatiaCubaCuracaoCyprusCzech RepublicDenmarkDjiboutiDominican RepublicEarly-demographic dividendEast Asia & PacificEast Asia & Pacific (excluding high income)East Asia & Pacific (IDA & IBRD countries)EcuadorEgypt, Arab Rep.El SalvadorEquatorial GuineaEritreaEstoniaEthiopiaEuro areaEurope & Central AsiaEurope & Central Asia (excluding high income)Europe & Central Asia (IDA & IBRD countries)European UnionFijiFinlandFragile and conflict affected situationsFranceFrench PolynesiaGabonGambia, TheGeorgiaGermanyGhanaGreeceGrenadaGuamGuatemalaGuineaGuinea-BissauGuyanaHaitiHeavily indebted poor countries (HIPC)High incomeHondurasHong Kong SAR, ChinaHungaryIBRD onlyIcelandIDA & IBRD totalIDA blendIDA onlyIDA totalIndiaIndonesiaIran, Islamic Rep.IraqIrelandIsraelItalyJamaicaJapanJordanKazakhstanKenyaKiribatiKorea, Dem. People’s Rep.Korea, Rep.KosovoKuwaitKyrgyz RepublicLao PDRLate-demographic dividendLatin America & Caribbean Latin America & Caribbean (excluding high income)Latin America & the Caribbean (IDA & IBRD countries)LatviaLeast developed countries: UN classificationLebanonLesothoLiberiaLibyaLithuaniaLow & middle incomeLow incomeLower middle incomeLuxembourgMacao SAR, ChinaMacedonia, FYRMadagascarMalawiMalaysiaMaldivesMaliMaltaMauritaniaMauritiusMexicoMicronesia, Fed. Sts.Middle East & North AfricaMiddle East & North Africa (excluding high income)Middle East & North Africa (IDA & IBRD countries)Middle incomeMoldovaMongoliaMontenegroMoroccoMozambiqueMyanmarNamibiaNepalNetherlandsNew CaledoniaNew ZealandNicaraguaNigerNigeriaNorth AmericaNorwayOECD membersOmanOther small statesPacific island small statesPakistanPanamaPapua New GuineaParaguayPeruPhilippinesPolandPortugalPost-demographic dividendPre-demographic dividendPuerto RicoQatarRomaniaRussian FederationRwandaSamoaSao Tome and PrincipeSaudi ArabiaSenegalSerbiaSeychellesSierra LeoneSingaporeSlovak RepublicSloveniaSmall statesSolomon IslandsSomaliaSouth AfricaSouth AsiaSouth Asia (IDA & IBRD)South SudanSpainSri LankaSt. LuciaSt. Vincent and the GrenadinesSub-Saharan Africa Sub-Saharan Africa (excluding high income)Sub-Saharan Africa (IDA & IBRD countries)SudanSurinameSwazilandSwedenSwitzerlandSyrian Arab RepublicTajikistanTanzaniaThailandTimor-LesteTogoTongaTrinidad and TobagoTunisiaTurkeyTurkmenistanUgandaUkraineUnited Arab EmiratesUnited KingdomUnited StatesUpper middle incomeUruguayUzbekistanVanuatuVenezuela, RBVietnamVirgin Islands (U.S.)West Bank and GazaWorldYemen, Rep.ZambiaZimbabwe Linha do tempo:
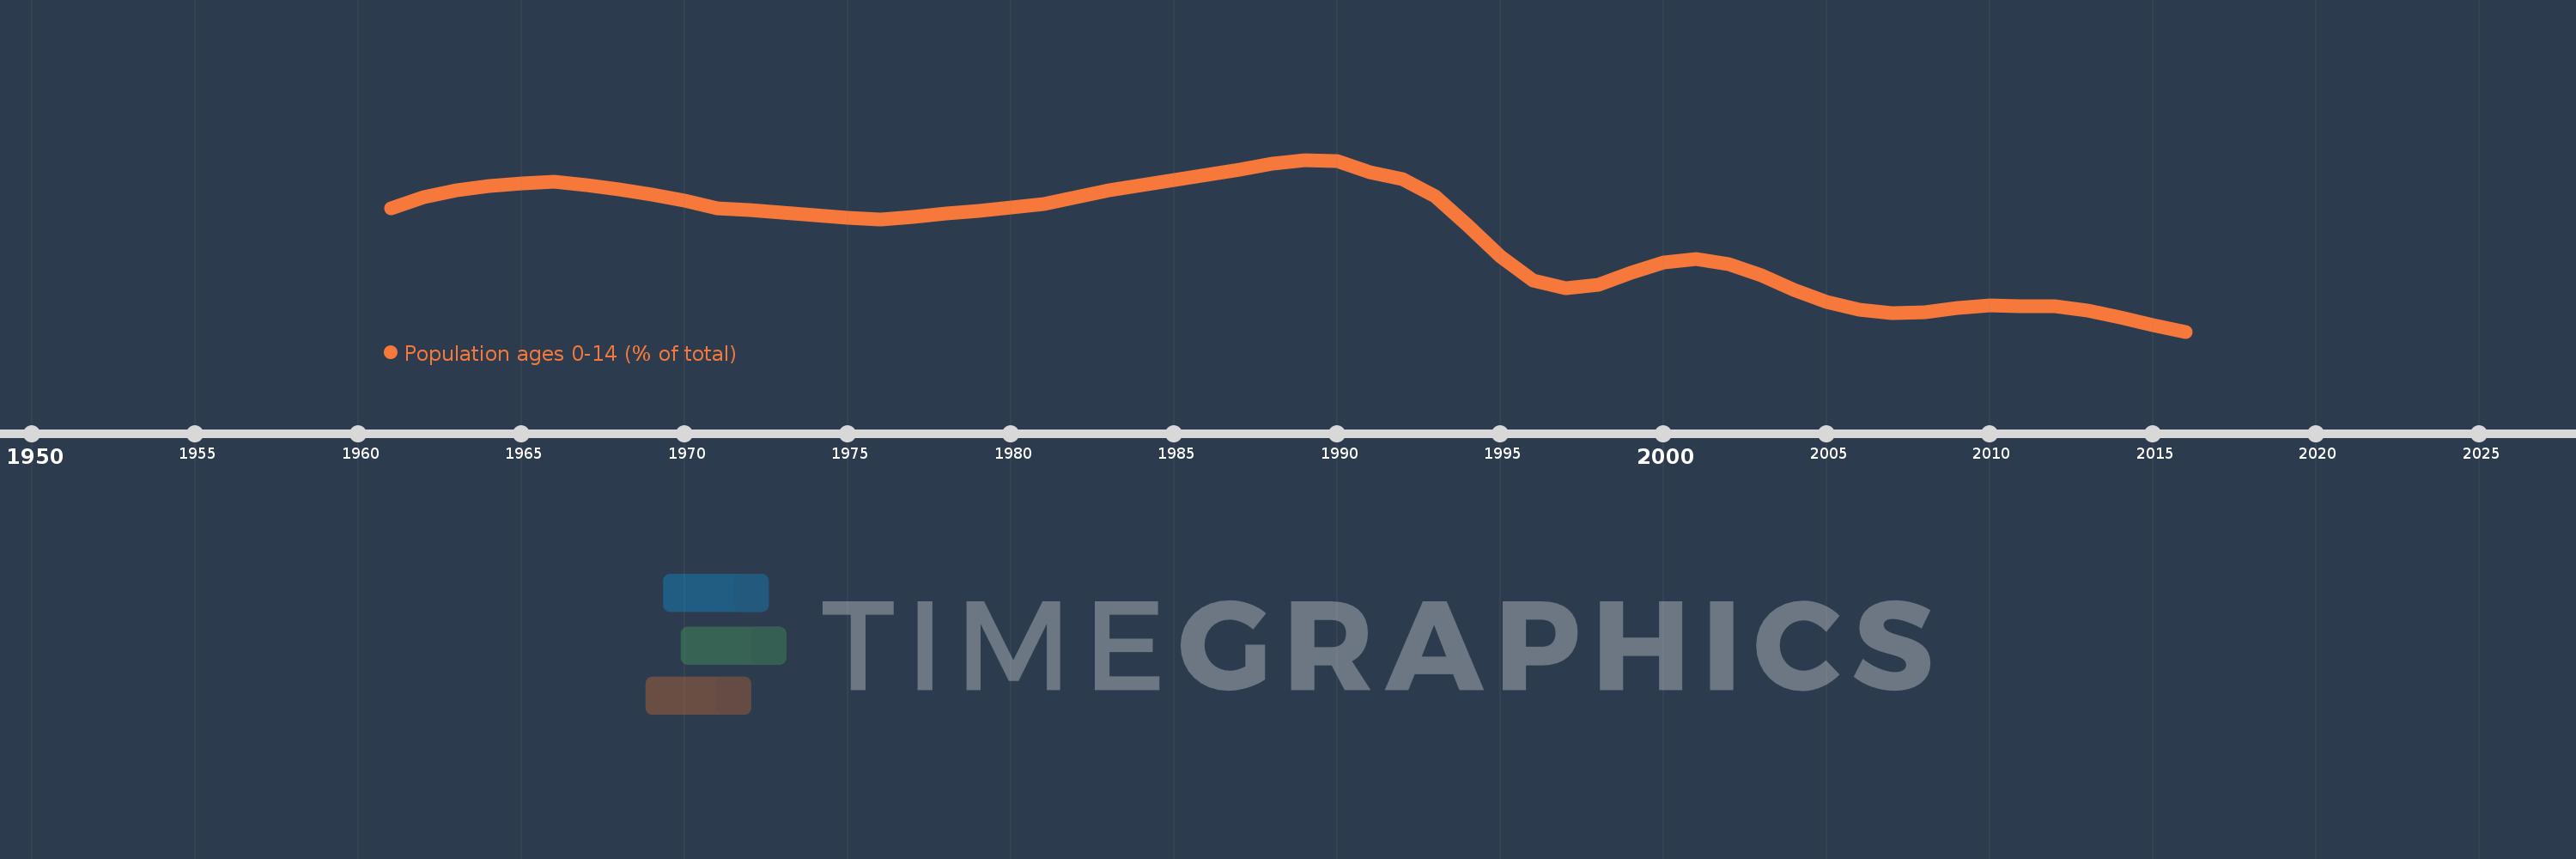
Nesta escala de tempo está apresentado um gráfico de 1961 ano até 2016 ano Rwanda. Dados de 1960 ano ausente. O número de observações reais por data: 56.
Fonte (nome):
Indicadores de desenvolvimento mundial
Fonte (organização):
World Bank staff estimates based on age distributions of United Nations Population Division's World Population Prospects.
Categorias:
Education, Health
Foi atualizado:
23 abr 2017 ano
Indicadores de alterações dos valores ao longo dos anos
Mínimo:
41.052
1 jan 2016 ano
Máximo:
50.44
1 jan 1989 ano
Na data de observação
Valor
Mudança absoluta
A alteração em relação ao valor anterior
1 jan 1961 ano
47.772
+47.772
0.0%
1 jan 1962 ano
48.4
+0.628
1.31%
1 jan 1963 ano
48.786
+0.386
0.8%
1 jan 1964 ano
48.995
+0.209
0.43%
1 jan 1965 ano
49.129
+0.134
0.27%
1 jan 1966 ano
49.242
+0.113
0.23%
1 jan 1967 ano
49.041
-0.201
-0.41%
1 jan 1968 ano
48.799
-0.242
-0.49%
1 jan 1969 ano
48.52
-0.28
-0.57%
1 jan 1970 ano
48.187
-0.332
-0.69%
1 jan 1971 ano
47.807
-0.38
-0.79%
1 jan 1972 ano
47.711
-0.096
-0.2%
1 jan 1973 ano
47.562
-0.149
-0.31%
1 jan 1974 ano
47.397
-0.166
-0.35%
1 jan 1975 ano
47.26
-0.137
-0.29%
1 jan 1976 ano
47.176
-0.084
-0.18%
1 jan 1977 ano
47.337
+0.162
0.34%
1 jan 1978 ano
47.497
+0.16
0.34%
1 jan 1979 ano
47.662
+0.165
0.35%
1 jan 1980 ano
47.833
+0.171
0.36%
1 jan 1981 ano
48.011
+0.178
0.37%
1 jan 1982 ano
48.421
+0.411
0.86%
1 jan 1983 ano
48.761
+0.34
0.7%
1 jan 1984 ano
49.049
+0.288
0.59%
1 jan 1985 ano
49.322
+0.273
0.56%
1 jan 1986 ano
49.605
+0.283
0.57%
1 jan 1987 ano
49.9
+0.295
0.59%
1 jan 1988 ano
50.207
+0.307
0.62%
1 jan 1989 ano
50.44
+0.233
0.46%
1 jan 1990 ano
50.37
-0.071
-0.14%
1 jan 1991 ano
49.769
-0.601
-1.19%
1 jan 1992 ano
49.399
-0.37
-0.74%
1 jan 1993 ano
48.426
-0.973
-1.97%
1 jan 1994 ano
46.872
-1.554
-3.21%
1 jan 1995 ano
45.136
-1.736
-3.7%
1 jan 1996 ano
43.823
-1.313
-2.91%
1 jan 1997 ano
43.437
-0.385
-0.88%
1 jan 1998 ano
43.627
+0.19
0.44%
1 jan 1999 ano
44.253
+0.626
1.44%
1 jan 2000 ano
44.837
+0.584
1.32%
1 jan 2001 ano
45.017
+0.18
0.4%
1 jan 2002 ano
44.742
-0.275
-0.61%
1 jan 2003 ano
44.149
-0.592
-1.32%
1 jan 2004 ano
43.352
-0.797
-1.81%
1 jan 2005 ano
42.656
-0.696
-1.61%
1 jan 2006 ano
42.262
-0.394
-0.92%
1 jan 2007 ano
42.051
-0.211
-0.5%
1 jan 2008 ano
42.108
+0.057
0.14%
1 jan 2009 ano
42.322
+0.215
0.51%
1 jan 2010 ano
42.477
+0.155
0.37%
1 jan 2011 ano
42.452
-0.025
-0.06%
1 jan 2012 ano
42.415
-0.037
-0.09%
1 jan 2013 ano
42.179
-0.236
-0.56%
1 jan 2014 ano
41.81
-0.37
-0.88%
1 jan 2015 ano
41.417
-0.393
-0.94%
1 jan 2016 ano
41.052
-0.365
-0.88%
Classificação de países por estatísticas atuais por anos


Comentários: